All the Foreign Bodies That Got Stuck
When you think emergency room, you often think real emergencies. Life and death situations where doctors have to act fast. Sometimes that’s the case, but as I’ve learned from my wife, who is an ER doctor, a lot of people come in for less life-or-death and some come in for more, um, surprising situations.
One type of case seems to always surprise though, and that is the one of foreign-body-stuck-in-patient-rectum variety. Some cases really are a million to one shot or are kids just doing kid things. Most of the time though it’s an accident after trying something on purpose.
Below is a sample of all the things people get stuck, based on data from the National Electronic Injury Surveillance System.
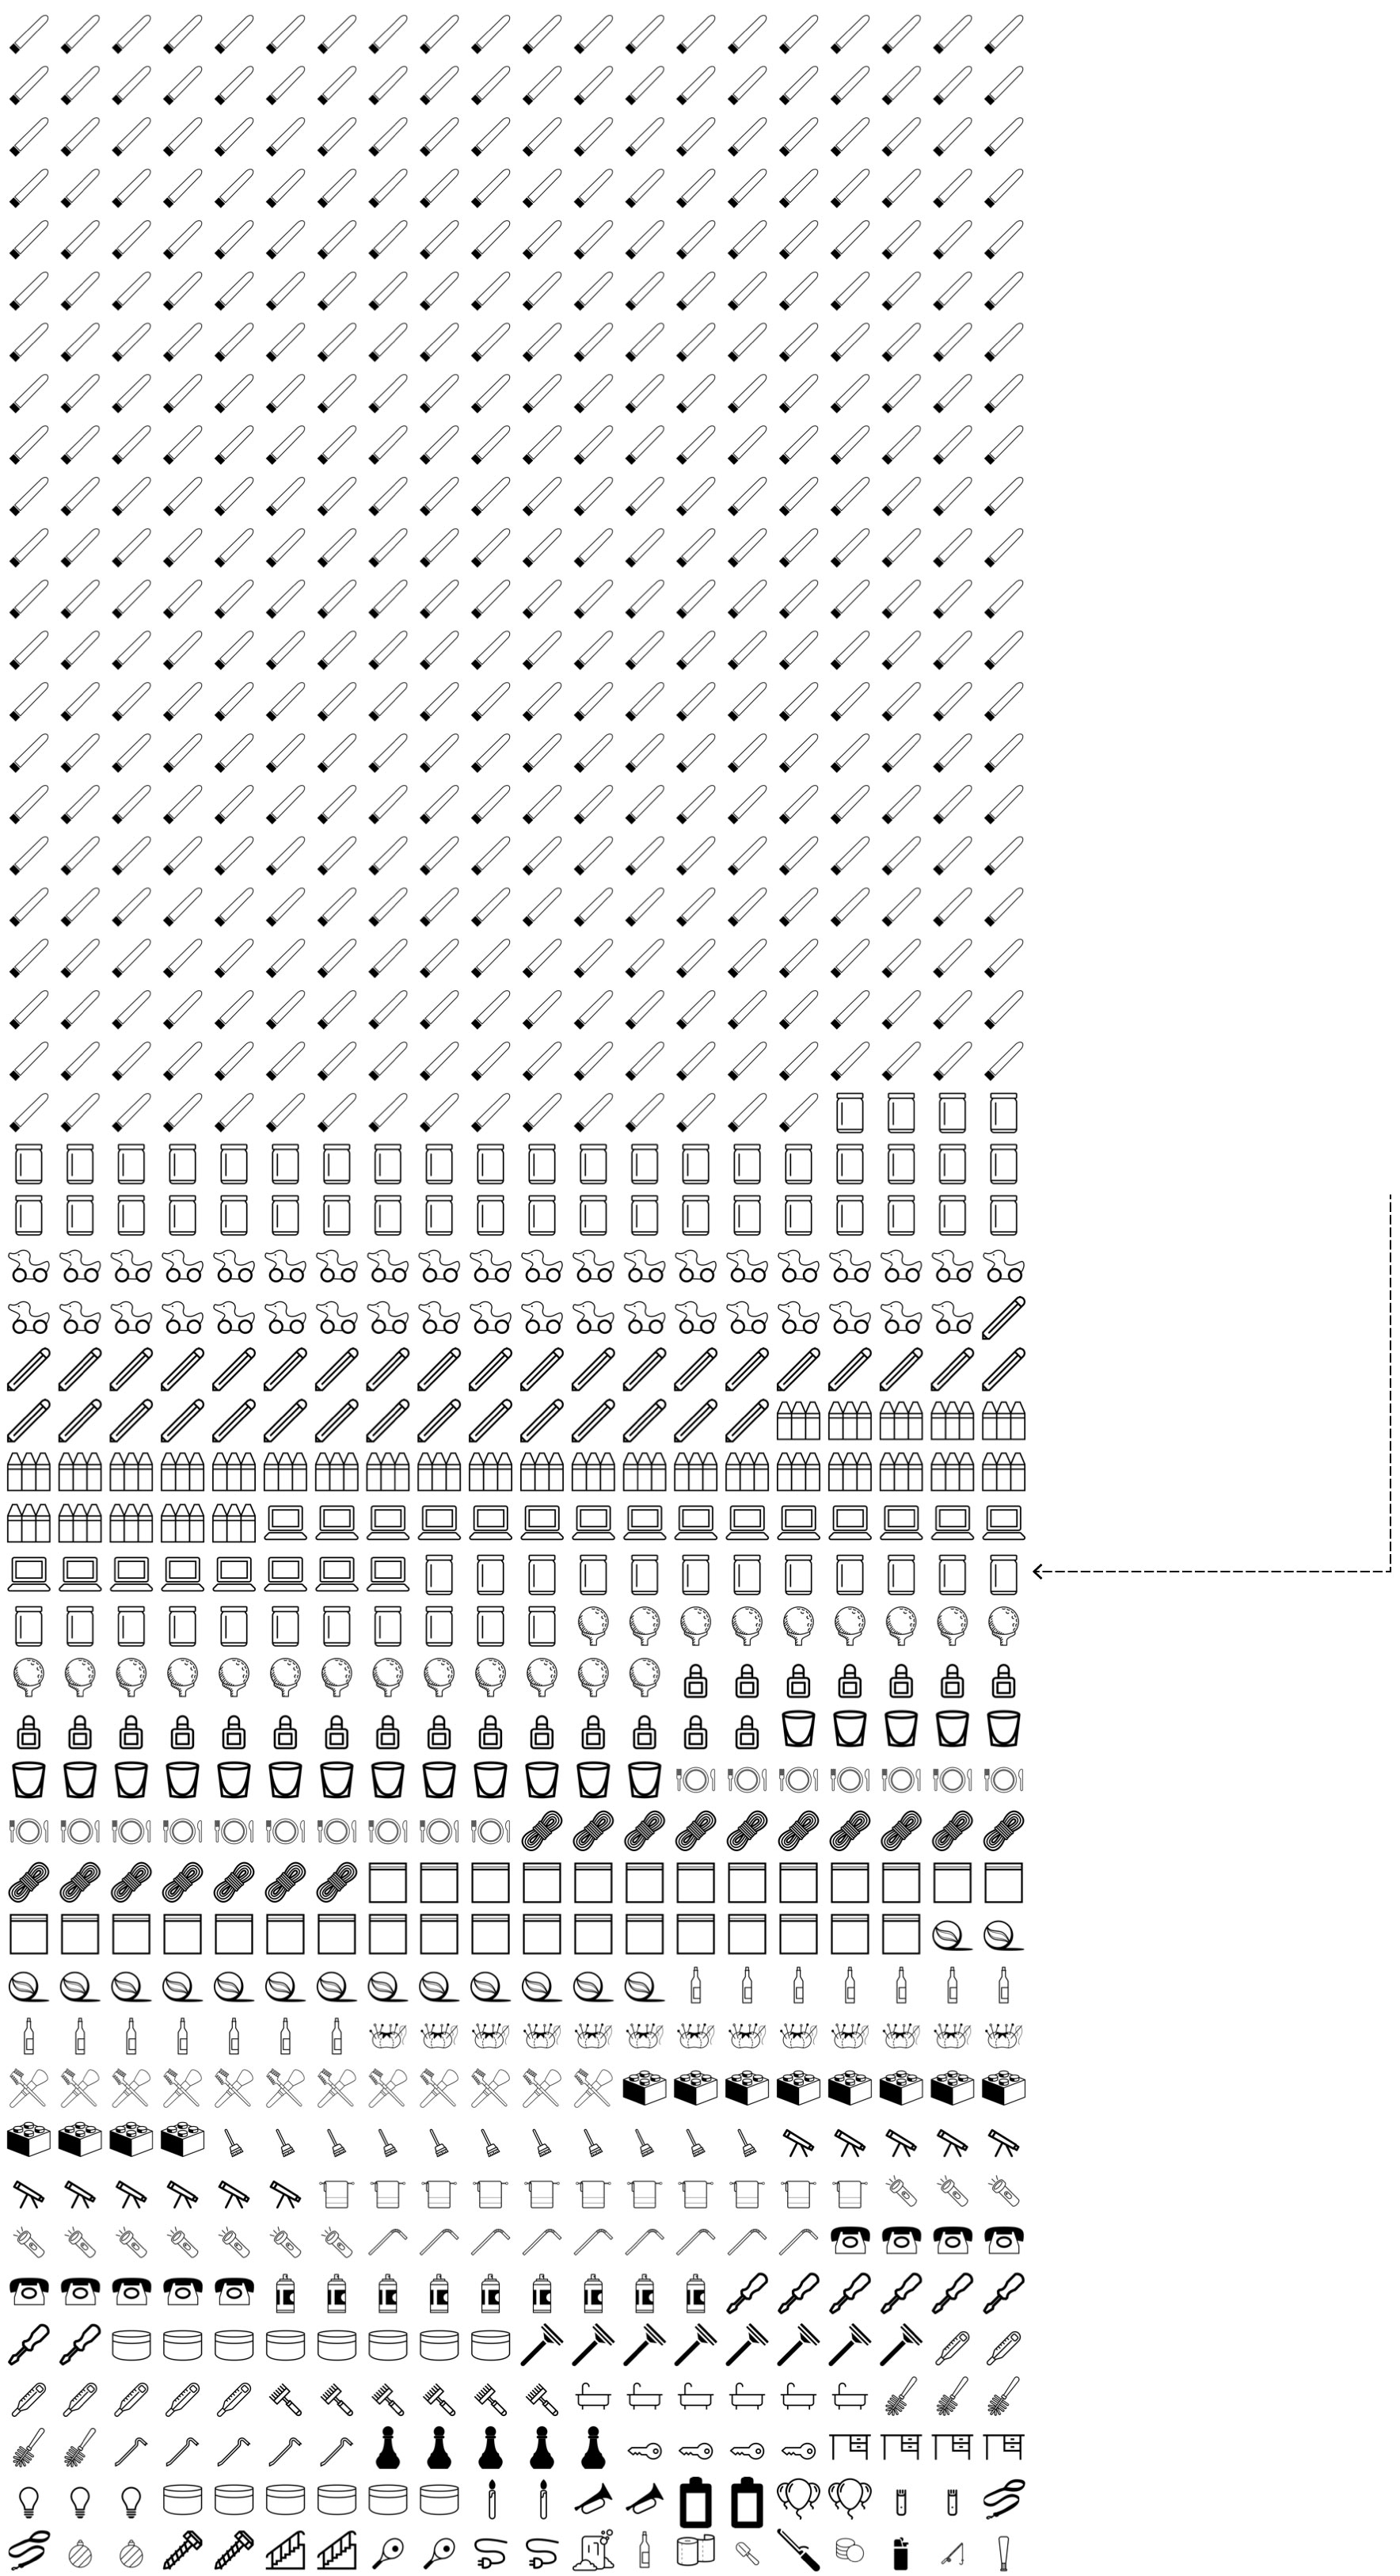
At 44%, massage devices or vibrators, excluding shower attachments, are the most common foreign body to get stuck.
Non-glass bottles or jars make up about 5% of the pool. Glass bottles and jars make up another 3 percent.
Kids end up in the ER unexpectedly, hence toys (4%), pens and pencils (4%), and crayons and chalk (2%) enter the picture.
Computer equipment, 1%
Golf equipment, 1%
Manicuring devices, 1%
Drinking glasses, 1%
Tableware, 1%
Rope or string, 1%
Bags, 1%
Marbles, 1%
Anything is possible. Other reported objects include but not limited to: sewing equipment, Christmas decorations, coins, baseballs, pet supplies, game pieces, soaps, brushes, cleaning equipment, and more.

At 44%, massage devices or vibrators, excluding shower attachments, are the most common foreign body to get stuck.
Non-glass bottles or jars make up about 5% of the pool. Glass bottles and jars make up another 3 percent.
Kids end up in the ER unexpectedly, hence toys (4%), pens and pencils (4%), and crayons and chalk (2%) enter the picture.
Anything is possible. Other reported objects include but not limited to: sewing equipment, Christmas decorations, coins, baseballs, pet supplies, game pieces, soaps, brushes, cleaning equipment, and more.
Eventually, everything seems to become fair game. I’ve got nothing against it, but maybe make sure you have a good grip on the object before you put it somewhere. There’s a lot of sensitive organs in that area.
Notes
- You can download data from the NEISS, going back to 1999. The above is a weighted sample using data from 2014 to 2018. It covers a lot more than rectal injuries.
- The case descriptions are also really interesting.
Chart Type Used

Become a member. Support an independent site. Get extra visualization goodness.
See What You Get