How Many Kids We Have and When We Have Them
A few years ago, it seemed like everyone I knew was having babies or trying to have babies. There were baby showers, baby gifts, baby visits, and of course the social feeds were filled with baby pictures. My wife and I also had a couple of kids.
But now that I’m older, it feels more like a trickle. Many parents stop at two kids. Most are done by three. Still, everyone has their own timelines.
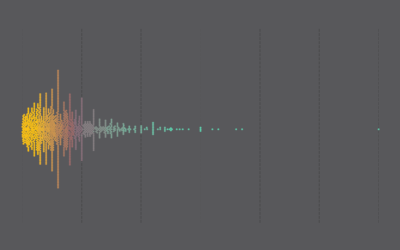
The chart above shows 1,000 timelines, based on data from the National Survey of Family Growth. Each moving dot is a mother. Age is on the horizontal, and with each live birth, the dot moves down a notch. The green bubbles represent the total counts for a given age.
You see the distribution for the first child clump up around mothers’ twenties, and the distributions shift older for additional kids.
There’s so much variation though in when people have kids and how many. I mean, 12 kids? Whoa. To each her own.
See also: Baby-Making Age and After Marriage, How Long People Wait to Have Kids.
Notes
- I pulled the data from the 2015-2017 release of the National Survey of Family Growth, which is run by the Centers for Disease Control and Prevention. It’s been running on and off since 1973. For the interactive, I took a weighted sample of 1,000 cases.
- I analyzed and prepared the data in R.
- I made the chart using D3.js.
Become a member. Support an independent site. Get extra visualization goodness.
See What You Get


