How to Download and Use Online Data with Arduino
Before you can do anything with data, you have to get it into the application. Working with an Arduino is no different. Although the process is changes, if you’re used to working with desktop software.
I’ve been interested in getting data off the computer screen lately, and the Arduino seems like a good step towards that. There’s something oddly satisfying about building a circuit and making an LED blink at your command.
The first thing to do though was to bring data from an outside source. In my case, I wanted it to be an online source. The great thing about getting started with an Arduino is that there are lots of examples to work from, but I couldn’t quite find what I wanted, so here’s what I did.
To the more experienced Arduino users: If you see how any of this could be made better, please feel free to drop let me know, as I just wanted to make something that worked.
Setup
I recommend the Arduino Ultimate Starter Kit or one of the generic kits, if you’re just getting into this stuff.In this tutorial I use an Arduino Uno and an Ethernet shield. You should also have the Arduino IDE installed on your computer so that you can upload sketches. That’s all you need for the download part. If you want to make some LEDs blink, you’ll need the basics: LEDs, resistors, a breadboard, and jumper wires.
Example data source
We’re going to go simple and read in three data points that looks like the following.
<rates>31.53732 72.87071 2.99379 </rates>
It’s three numbers enclosed in a rates tag, separated by single spaces. Getting into the holiday spirit, I’m querying Twitter every ten minutes to estimate how many tweets per minute mention “happy holidays”, “merry Christmas”, and “happy new year”. Each rate above is the estimate for a phrase, respectively, and the file is accessible online as plain text.
I’m using the twython library for Python in case you’re interested in rolling your own Twitter thingy. You might also be interested in this quick start guide for using the Tweepy library to scrape tweets.
See the tutorial download for my rough querying Python script.The main point is that we have some online data that we can access, and we want to get that data to the Arduino.
Reading in data to Arduino
Assuming you have the ethernet shield on and plugged in, with the Arduino running, let’s get into it.
Include the SPI library to communicate with the serial port and the Ethernet library to get an online connection.
#include <SPI.h>
#include <Ethernet.h>
Then set some initial variables. The ones below are settings for an Internet connection and pointers to where the data is.
// Enter a MAC address for your controller below.
// Newer Ethernet shields have a MAC address printed on a sticker on the shield
byte mac[] = { 0xDE, 0xAD, 0xBE, 0xEF, 0xFE, 0xED };
char server[] = "projects.flowingdata.com";
String dataLocation = "/holidays/current-rates.txt HTTP/1.1";
Initialize an Ethernet client and set a few more variables that you’ll use soon.
EthernetClient client;
String currentLine = "";            // string for incoming serial data
String currRates = "";
boolean readingRates = false;       // is reading?
const int requestInterval = 900000; // ms delay between requests (15 min)
And a few more settings for how often you want to look for new data.
boolean requested;         // whether you've made a request since connecting
long lastAttemptTime = 0;  // last time you connected to the server, in ms
Okay, that was fairly straightforward. Getting into main bits, Arduino code follows a typical structure of setup() and loop(). If you’re familiar with the Processing language, this will be familiar to you. The first part, as the name suggests, sets up your program, to get it ready to run so to speak. Once the code starts, the stuff inside loop() iterates over and over until you tell it to stop.
void setup() {

}

void loop() {

}
You can access the Serial Monitor via the Tools menu in the Arduino IDE or the magnifying glass on the top right corner.Start with the setup. Open serial communications so that you’ll be able to print output on your computer for debugging. Then open an Ethernet connection. If it doesn’t work, print it to the Serial Monitor.
void setup() {
  // Open serial communications and wait for port to open:
  Serial.begin(9600);

  // start the Ethernet connection:
  if (Ethernet.begin(mac) == 0) {
    Serial.println("Failed to configure Ethernet using DHCP");
    // no point in carrying on, so do nothing forevermore
  }

  // Connect to server
  connectToServer();
}
The last function call connects to the server specified in the initial variables. Here is the code for that function which uses the EthernetClient to request the data at dataLocation. Each time there is a request to connect, the timestamp is stored in lastAttemptTime.
void connectToServer() {
  // attempt to connect, and wait a millisecond:
  Serial.println("connecting to server...");
  if (client.connect(server, 80)) {
    Serial.println("making HTTP request...");

    // make HTTP GET request to dataLocation:
    client.println("GET " + dataLocation);
    client.println("Host: projects.flowingdata.com");
    client.println();
  }
  // note the time of this connect attempt:
  lastAttemptTime = millis();
}
On to the loop(). If the client is connected and there is data available, you store the incoming bytes. If there is no connection, and it’s time to make another server request, call connectToServer() again.
void loop() {
  // Checking for new data
  if (client.connected()) {
    if (client.available()) {
      // read incoming bytes:
      char inChar = client.read();

      // add incoming byte to end of line:
      currentLine += inChar;

      ...
  }

  else if (millis() - lastAttemptTime > requestInterval) {
    // if you're not connected, and requestInterval has passed since
    // your last connection, then attempt to connect again:
    connectToServer();
  }
}
Let’s pause here for a moment. To understand the snippet above and what comes next, you must know how the data comes in. When you work with a desktop computer, you can usually load a file in its entirety and not have to think about how that gets done. For example, in R, you make a call to read.csv() to load a CSV file into your workspace, and you can play the resulting data frame.
However, the Arduino has relatively less memory and less stuff under the hood to process other stuff for you. Instead, a call to client.read() brings a single character. You don’t all the rates in one iteration. You get one character per iteration of loop().
You also get header information when you request a web page that you typically don’t see when you use a browser on your computer or mobile device. For the purposes of this tutorial, you don’t care about the header. You just want the numbers inside the rates tags.
Okay. This is how you do it. Remember: You’re moving along character by character.
You look at the current character with client.read() and you append it to currentLine. If you’ve reached the end of a line, encoded with ‘\n’, you reset currentLine. Otherwise, move along.
      // if you get a newline, clear the line:
      if (inChar == '\n') {
        currentLine = "";
      }
If the currentLine reads “readingRates to true.
      if (currentLine.endsWith("<rates>")) {
        readingRates = true;
      }
At this point, you’ve moved past the header and iterated through <, r, a, t, e, s, and >. Now loop() iterates, and you store the incoming characters in currRates until you reach the end.
      else if (readingRates) {
        if (!currentLine.endsWith("</rates>")) { //'>' is our ending character
          currRates += inChar;
        }

        ...
      }
If you were to print the output to the serial port, you would see a line similar to the example data at the beginning of this tutorial, including the end tag without the start tag. So something like the following:
31.53732 72.87071 2.99379 </rates>
Use substring() to get rid of the end tag.
...
        else {
          readingRates = false;

          String justRates = currRates.substring(0, currRates.length()-8);
          ...
        }
Then split the resulting string of numbers by space.
...
          // Split justRates
          int firstSpaceIndex = justRates.indexOf(" ");
          int secondSpaceIndex = justRates.indexOf(" ", firstSpaceIndex+1);
          String firstVal = justRates.substring(0, firstSpaceIndex);
          String secondVal = justRates.substring(firstSpaceIndex+1, secondSpaceIndex);
          String thirdVal = justRates.substring(secondSpaceIndex);
See the strToFloat() helper function in the tutorial source to see how it works.This gives you three strings, each matching the value in the online data file. Convert the strings to floats, so that you can do math with the values.
...
          // Convert strings to floats and store
          tweetsPerMin1 = strToFloat(firstVal);
          tweetsPerMin2 = strToFloat(secondVal);
          tweetsPerMin3 = strToFloat(thirdVal);
The Arduino now has the data. Reset and close the client connection.
          // Reset for next reading
          currRates = "";
          client.stop();
The Ethernet shield has a microSD card slot if you need more memory. Use the SD library to read from the card.And there you go. Although this is only for three values and one line, you can follow similar logic for more values and lines. But pay attention to the amount of memory.
Representation
With the data downloaded and stored, you can do what you want representation-wise. Make things turn on and off, move things with motors, blink some lights, etc.
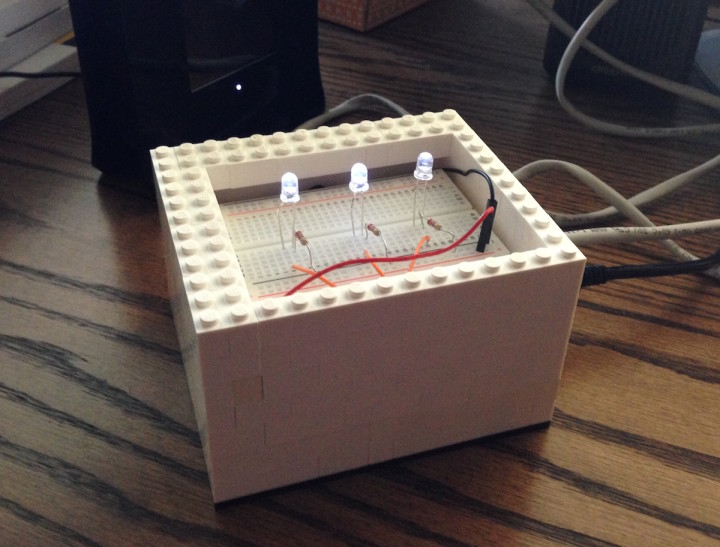
I won’t go into much detail here since the point of this tutorial is to download data, but the tutorial source download blinks and fades three LEDs based on the data. The higher the tweets per minute for a phrase, the longer the LED stays on. When the rate is below a certain threshold, the light just blinks a little bit with a longer delay. Here’s what it looks like now:
Nothing fancy but kind of fun to glance at with it here sitting on my desk.
The left LED shows happy new year, the one in the middle is merry Christmas, and the one on the right is happy holidays. The LEGOs are for me.
Wrapping up
The meat of this sketch is handling the incoming bytes. There are lots of examples on how to use an Ethernet shield and make connections, and there are plenty of variations on how to go about it. But once you have that connection and request an online resource there are two things to do:
- Grab only the parts of the resource that is actual data. Ignore the rest.
- Parse the data and store.
From there, with data in hand, represent however you want.
Made possible by FlowingData members.
Become a member to support an independent site and learn to make great charts.
About the Author
Nathan Yau is a statistician who works primarily with visualization. He earned his PhD in statistics from UCLA, is the author of two best-selling books — Data Points and Visualize This — and runs FlowingData. Introvert. Likes food. Likes beer.