Working on Tips, by State
What percentage of a waiter and waitress’s income comes from tips and what comes from salary? The calculation isn’t straightforward for several reasons.
The IRS only asks for taxable income rather than splitting between tips and wages. There’s also underreporting for tip income, either on purpose or unintentionally, because a lot of tips come as loose cash. Square estimated tipping percentage by state a while back based on people using their service, but that comes with the caveat that it only represents business that use square, and it only counted credit card transactions.
But hey, we can at least try to figure out the split.
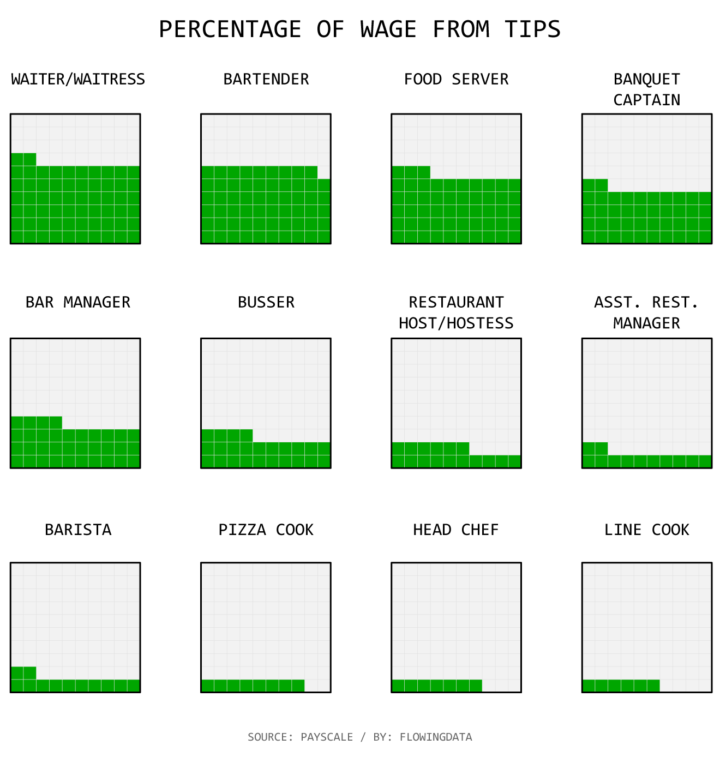
One place to start might be the PayScale Restaurant Report, which surveyed restaurant workers. Here’s what they calculated for percentage of income that comes from tips, by job. Waiters and waitresses reported on average 62 percent.
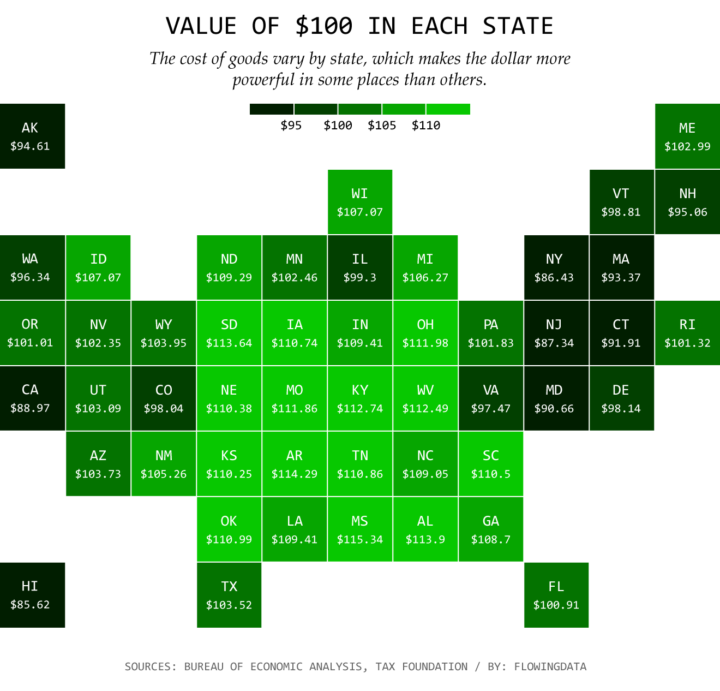
There are some things we need to consider though. For example, a dollar is worth more and less in various states. That is, it costs more to live in some states than in others. The Bureau of Economic Analysis released a report on the differences. Tax Foundation used the the dataset to calculate the relative value of $100 in each state, as shown below.
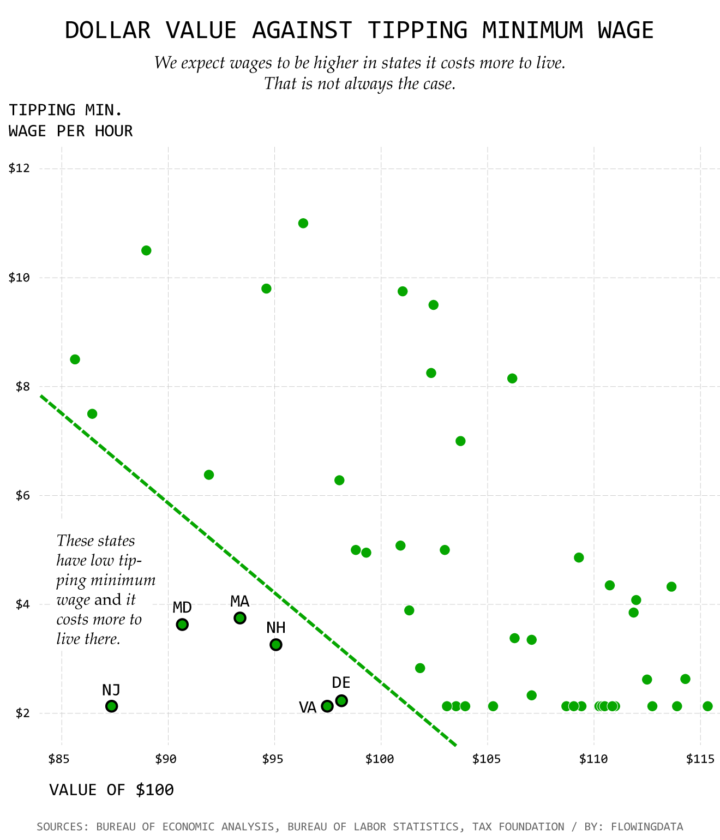
With this in mind, also note that each state has different rules for tipped minimum wage, which isn’t the same as regular minimum wage in most states.
You’d expect that in states where it costs a lot to live, the tipped minimum wage would be higher to compensate. While that’s the general trend, a handful of states have a relatively low tipped minimum wage and expensive living.
Maybe waiters and waitresses in the bottom left corner make a lot in tips? Kind of. When you adjust tipped minimum wage and hourly median pay (based on estimates from the Bureau of Labor Statistics) for the value of a dollar in each state, most hourly medians fall in between $9 and $11 per hour. Although check out Vermont and Hawaii hovering up there around $14 an hour.
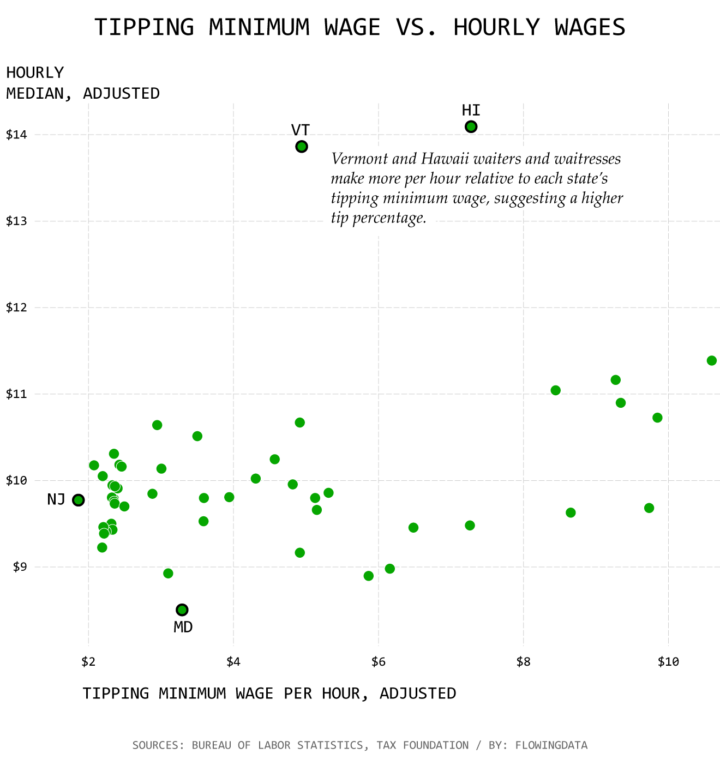
Of course, it’s possible a lot of restaurant servers make more than tipped minimum wage as their base, but it still seems like a good baseline to compare to. It’s interesting that the hourly median for Vermont and Hawaii are both about twice as that of the minimum wage in the respective states.
Bottom line: If you can swing it, tip your waiters and waitresses. Because they do work on tips.
 How to Make Square Pie Charts in R
Here’s a tutorial to make the graphic up top.
Chart Types Used


Become a member. Support an independent site. Get extra visualization goodness.
See What You Get