Charting All the Beer Styles

♫ 100 bottles of beer (styles) on the wall, 100 bottles of beer (styles)… ♫

A common mistake about beer is that there are basically two types: the super-drinkable variety and the super-hoppy and bitter variety. For the first type you have your Bud Light and Corona, and for the second you have any IPA.

There’s so much more to try though, spanning a wide range of taste, flavors, and malt.

The Beer Judge Certification Program lists 100 styles with defined ranges of alcohol by volume (ABV), bitterness (measured in IBUs, or International Bittering Units), and color (measured using SRM, or Standard Reference Method).

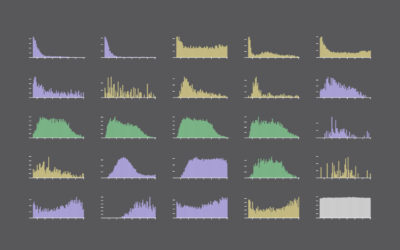
Below is a series of charts for all 100 styles. Mouseover any style for more details and commercial examples. Rectangles to the top right corner represent beer that is high in alcohol and high in bitterness. In contrast, a rectangle in the bottom left corner represents a beer that is low in alcohol and low in bitterness.

You’ll notice that the lighter beers tend to have a tighter range of ABV and IBUs, whereas the bigger beers tend to vary more.
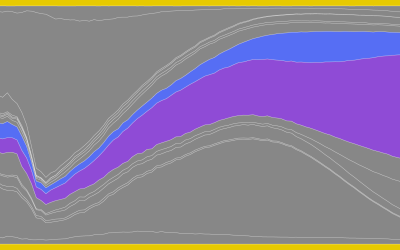
Become a member. Support an independent site. Make great charts.

See What You Get

Learn to Visualize Data See All →

How to Draw Maps with Hatching Lines in R

Fill areas with varying line density to give more or less visual attention. With geographic maps, the technique is especially useful to adjust for population density.

How to visualize data with cartoonish faces ala Chernoff

The goal of Chernoff faces is to show a bunch of variables at once via facial features like lips, eyes, and nose size. Most of the time there are better solutions, but the faces can be interesting to work with.

How to Make a Smoother Animated Growth Map in R

Show change over time and geography with smooth transitions.

How to Make Bubble Clusters in R

Represent individual counts with grouped units to make data feel less abstract.

Favorites

Where People Run in Major Cities

There are many exercise apps that allow you to keep …

How Much the Everyday Changes When You Have Kids

I compared time use for those with children under 18 against those without. Here’s where the minutes go.

Unemployment in America, Mapped Over Time

Watch the regional changes across the country from 1990 to 2016.

Divorce Rates for Different Groups

We know when people usually get married. We know who never marries. Finally, it’s time to look at the other side: divorce and remarriage.