Most popular porn searches, by state

We’ve seen that we can learn from what people search for, through the eyes of Google suggestions: state stereotypes, national stereotypes, and even the insecurities of age. Do we see anything when we look at porn searches?
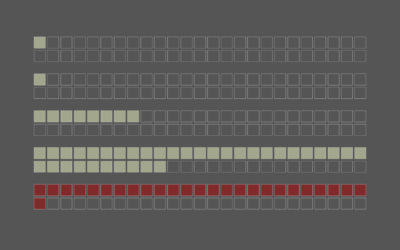
PornHub released a small dataset on the three most popular searches for each state. Their map only shows the top search, which is limiting, but the chart above incorporates all queries. If a term was in a state’s top three, the state is shaded black.
There are interesting regional patterns in there, as you sweep from more widely spread searches to the more specific. I thought the maps in the middle were most interesting. I’ll let you make your own conclusions (and maybe some googles for definitions) though.
PornHub also provided average time spent on the site per visit, but I pretty much ignored that column. The inclination seems to be to infer stamina from the amount of time spent on the site, but there are plenty of other reasons for why a state’s average might be shorter or longer, such as internet speed, length of videos usually watched, or just a tendency to spend less time on sites.
Just note that the bar chart by PornHub starts at 10 minutes, which makes Rhode Island’s average duration look a lot shorter. However, there’s only a two-minute span between the least and greatest.
Anyways…
Become a member. Support an independent site. Get extra visualization goodness.
See What You Get