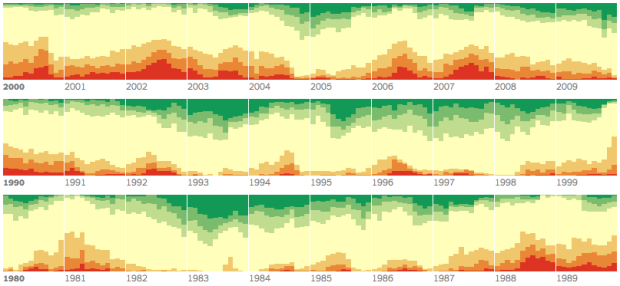
Although California has perhaps had it the worst, drought also affects other states, mainly the southwestern ones. Mike Bostock and Kevin Quealy for the New York Times have been updating an animated map weekly. It shows the spread of drought severity, across the United States. But, be sure to scroll down to also see drought levels over time, shown as stacked area chart.
Second Edition
 Visualize This: The FlowingData Guide to Design, Visualization, and Statistics (2nd Edition)
 Visualize This: The FlowingData Guide to Design, Visualization, and Statistics (2nd Edition)
New tools, refined process.