Coffee Place Geography

My fascination with the geography of place and businesses continues. We looked at pizza spots and grocery store locations, and as expected, saw variation and regionality across the country. This time we look at coffee places.
My expectation was that Starbucks and Dunkin’ Donuts would dominate, with 10,000-plus and 7,000-plus locations nationwide, respectively. This wasn’t far-fetched when you look at the map above. It shows the nearest coffee place among the popular chains, within a 10-mile radius.
Starbucks is all over, whereas Dunkin’ Donuts clearly dominates on the east coast. And like the pizza map that showed a favorite in Godfather’s Pizza in the midwest, there’s a midwest coffee favorite in Caribou.
I mapped popular Canadian coffee places, too, for good measure: BLENZ, Coffee Time, and Tim Hortons. I was mainly interested in Timmy Ho’s though because of my three-year stay in Buffalo, New York. It seemed like you were either in the Timmy camp or Starbucks. My wife and I were more into Dunkin’ Donuts. But I like that you can kind of make out the Canada-United States border just by looking at Tim Hortons.
Here are the coffee places in their own maps.
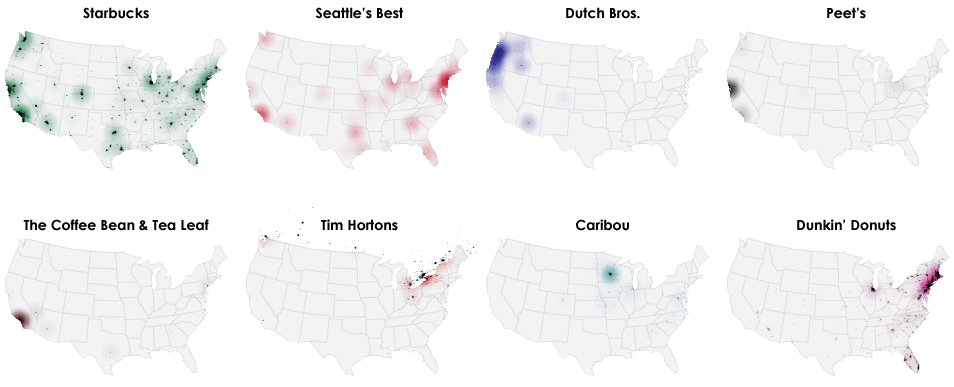
Again, Starbucks and Dunkin’ Donuts show high density in their respective regions. Seattle’s Best is similar to Starbucks regionally, but there are far fewer locations. Not that it matters anymore, since it’s owned by Starbucks now. Then you have Dutch Brothers in the northwest, Peet’s in northern California, and The Coffee Bean & Tea Leaf in southern California.
The spatial concentration in cities didn’t surprise me so much, but the cumulative coverage of the coffee places did. I expected to see something more like the pizza map, however, there are lots of areas in the country where it is more than ten miles to the nearest chain. For reference, here’s pizza coverage versus coffee coverage:
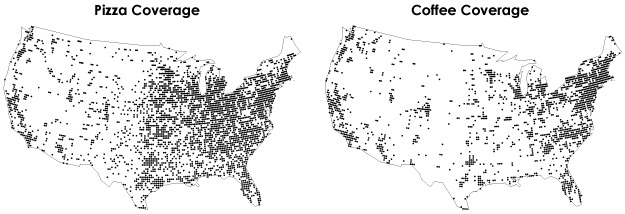
I’m not totally sure why this is. I’ve only lived on the east and west coasts. Not so much anywhere else. Maybe fancy coffee drinks aren’t as ubiquitous as I thought. Or maybe people get their coffee from mom-and-pop places. Or maybe people in these areas tend to drink coffee at home, and it’s not profitable enough for these chains to open shop? Are these areas more into soda and tea? The why needs more investigation.
We can at least see that where there is coffee (and donuts), there tends to be a lot of locations. You’re not going to find several Pizza Huts in close vicinity to each other, but it’s fairly common with Starbucks.
Thanks to AggData for feeding my location habit.
Chart Type Used

Become a member. Support an independent site. Get extra visualization goodness.
See What You Get