Line Chart
Typically used to show trends over time, the slope of the line between two points shows patterns of change.

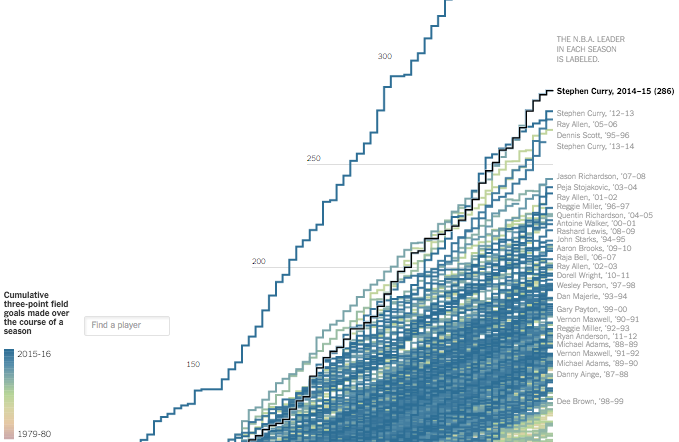
Stephen Curry 3-point record ridiculousness
Stephen Curry made 402 three-pointers this regular season, which is ridiculous. Gregor Aisch…
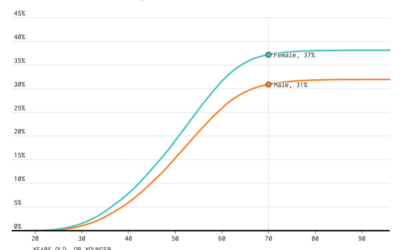
Divorce Rates for Different Groups
We know when people usually get married. We know who never marries. Finally, it's time to look at the other side: divorce and remarriage.
Marrying Age
People get married at various ages, but there are definite trends that vary across demographic groups. What do these trends look like?

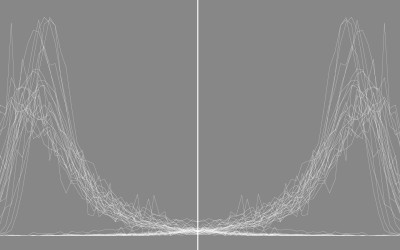
Years You Have Left to Live, Probably
The individual data points of life are much less predictable than the average. Here's a simulation that shows you how much time is left on the clock.

How to Make Line Charts in R
Learn to draw lines wherever and however you want, and you've got yourself some flexibility.
Using Transparency in R to Improve Clarity
When you plot a lot of data at once, points and lines can obscure others and hide patterns. Transparency can help reveal what is really there.
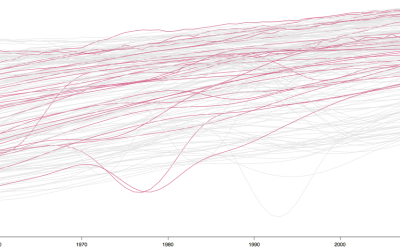
Interactive Time Series Chart with Filters
Time series charts can easily turn to spaghetti when you have multiple categories. By highlighting the ones of interest, you can direct focus and allow comparisons.
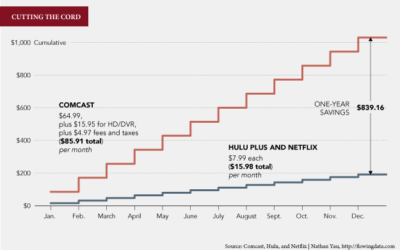
Why I Want to Quit Cable
There are good reasons to cancel cable, but there were a few channels and programs that kept me on. When you look at it in dollars though, it's hard to justify the value for the cost.
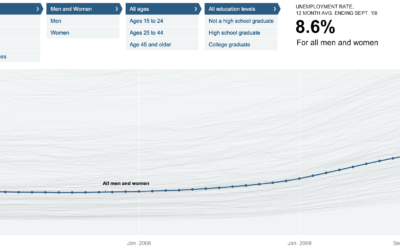
Unemployment Rate For People Like You – NYT Interactive
Shan Carter, Amanda Cox, and Kevin Quealy of The New York Times explore…