Dot Plot
A generalized form of the scatter plot, the dots can be placed in various coordinate systems.
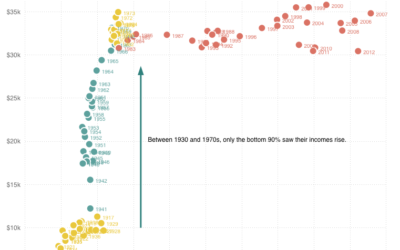
Top 1% earners versus bottom 90%
Quoctrung Bui for Planet Money plotted average income for the top one percent…
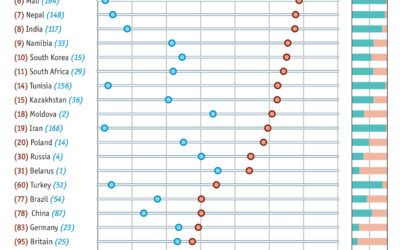
Alcohol consumption per drinker
We’ve seen rankings for alcohol consumption per capita around the world. These tend…
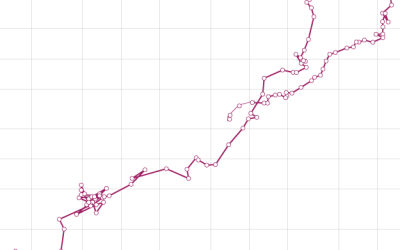
How to Make a Connected Scatter Plot
The combination of a time series chart and a scatter plot lets you compare two variables along with temporal changes.
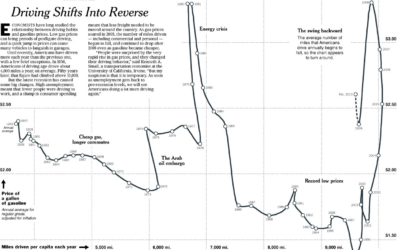
Driving habits and gas prices shift into reverse
Hannah Fairfield of the New York Times looks at driving habits and gas…
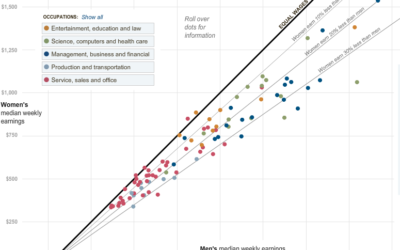
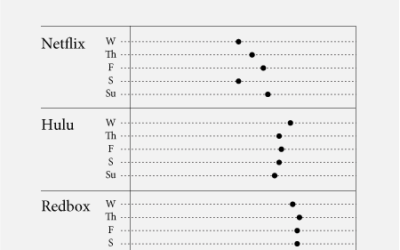
Paycheck Gap Between Men and Women – Guess Who Makes Less
Hannah Fairfield and Graham Roberts from The New York Times show the disparity…