There are many brands on Twitter that exist to uphold an image of the company they represent. As consumers, we can communicate with these accounts, voicing praise or displeasure (usually the latter). Using a simple sentiment classifier1, I scored feelings towards major brands from 0 (horrible) to 100 (excellent) once a day for five days.
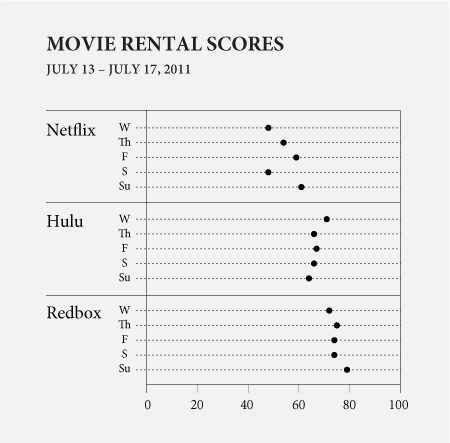
The above for example, shows scores for Netflix, Hulu, and Redbox. Netflix had the lowest scores, whereas Redbox had the highest. I suspect Netflix started low with people still upset over the price hike, but it got better the next couple of days. Then on Saturday, there was a score drop, which I’m guessing was from their downtime for most of Saturday. Hulu and Redbox, on the other hand, held more steady scores.
As for auto brands, Toyota clearly had the lowest scores. However, Lexus, which is actually a luxury vehicle division of Toyota had the highest scores in the high 90s to 100.

How about the major mobile phone companies, AT&T, Verizon, and Sprint? Verizon scored better initially, but had lower scores during the weekend. Not sure what was going on with Sprint.

Between Twitter and Facebook, there was obviously some bias, but Twitter faired slightly better. Twitter scored lower than I expected, but it probably has to do with bug reports directed towards @twitter.

Is Domino’s Pizza good now? Papa John’s stayed fairly steady while Pizza Hut scores were sub-par.

Finally, as a sanity check, I compared airlines like Breen did in his tutorial. Results were similar with JetBlue and Southwest clearly in the positive and the others picking up the rear.

Any of these scores seem surprising to you?
- Jeffrey Breen provides an easy-to-follow tutorial on Twitter sentiment in R. The scoring system is pretty basic. All you do is load tweets with a given search phrase, and then find all the “good” words and “bad” words. Good words give +1, and bad words give -1. Then a tweet is classified good or bad based on the total. Then to get a final score, only tweets with total of +2 or more or -2 or less are counted. The final score is computed by dividing number of negative tweets divided by total number of “extreme” tweets. Obviously this won’t pick up on sarcasm, but the scoring seems to still do a decent job. I wouldn’t make any important business decisions based on these results though.

 Visualize This: The FlowingData Guide to Design, Visualization, and Statistics (2nd Edition)
Great presentation of your results.
I also used Jeffrey’s technique to analyse political sentiment of the carbon tax that is being implemented here in Australia.
You can see it at: http://blog.thmcmahon.com/2011/data-analysis-of-twitter-reaction-to-the-carbon-tax/
Love the clean presentation but hard to get accurate takeaways from the data. Sentiment analysis is going to be a tough nut to crack for the next little while!
David, if you’d like a deeper look, check out a conference I’ve organized, the Sentiment Analysis Symposium, http://sentimentsymposium.com .
Seth
I agree with David here. I think such kind of data should be analyzed when they are taken from much longer period of time.
Hi Nathan:
Thanks for the shout out! This is a beautiful presentation of the data — but I guess that’s a given :)
Agree with David and Helen, but in addition to longer-term monitoring, shorter time scales can be interesting too. When I was collecting tweets for the original tutorial, I finished just before United’s reservation system went down for 4 or 5 hours.
It would also be interesting to see if certain stories which get picked up in the press cause negative “echoes” (or waves?) in sentiment. I’m thinking of the recent firestorm when Delta charged returning soldiers thousands of dollars in baggage fees. Even after Delta made it right, there was still a lot of activity online about it for days.
Anyway — love the site and enjoying the book!
Thanks,
Jeffrey
How about some error bars on those plots? It’s hard to judge changes without some calibration for uncertainty.
Hadley, given that we’re reading from Twitter — no scientific sample here — I’d guess accurate error bars would need to stretch from 0 to 100.
Seth
If that was the case, then there’d be no point looking at the data.
Given that this seems to be based on a ‘census’ rather than a sample of tweets mentioning these brands in a certain time period there is no sampling error to construct error bars for here.
This is cool, but not sure what to make of it. I feel like there is too much variability and one can really only take away: “Which brand is better?” and “Is there a difference among brands?”
We can create stories about why Netflix has poorer sentiment on that Saturday (lots of people watching and having trouble, or is that the day fees went up?), but it is not very defensible.
Still, a lot can be done with this if more data is taken into account, and perhaps news about each company (like Google does with Trends).
May I ask how you made your graphs? I want to be like you!!