Visualization
Showing the stories in data through statistics, design, aesthetics, and code.
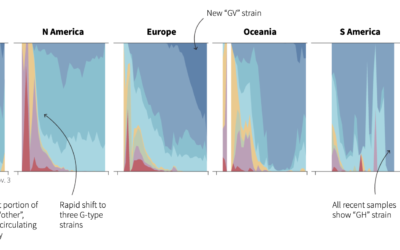
Evolution of coronavirus strains
Reuters looked at how seven main strains of the virus evolved around the…
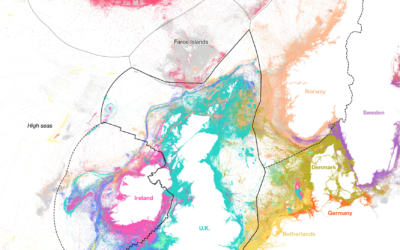
Who catches the most fish
Using data from Global Fishing Watch, Hayley Warren and Ian Wishart for Bloomberg…
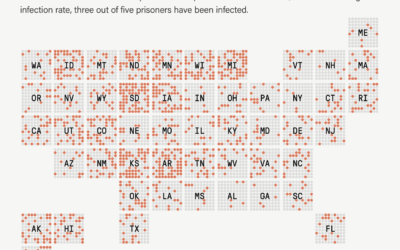
1 in 5 prisoners had Covid-19, a grid map
The Marshall Project and The Associated Press report on the Covid-19 rates in…
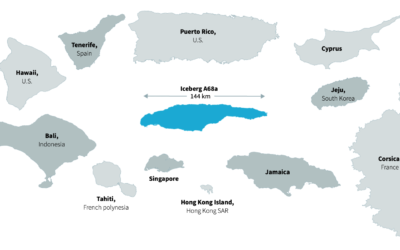
Tracking world’s biggest iceberg
The world’s biggest iceberg, A68a, is on track to crash into a remote…

Basketball court designed as a national park map
Kirk Goldsberry, whose basketball charts you might recognize, made the Naismith International Park…

Infrared to show air particles from your talk hole
I’m sure you know this already, but just in case, air particles come…
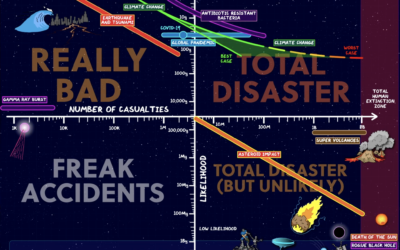
Charting and ranking apocalyptic events
For Domain of Science, Dominic Walliman attempts to chart all of the deadly…
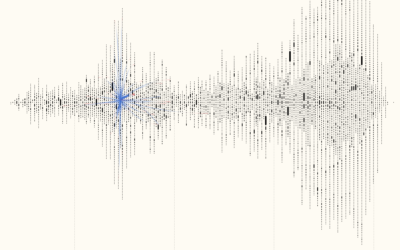
Visualizing 16th century letter correspondence of the Tudor government
Kim Albrecht, Ruth Ahnert, and Sebastian Ahnert visualized the network of communications over…
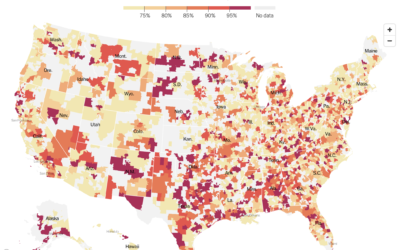
Where ICUs are near capacity
The New York Times mapped the seven-day average of ICU bed occupancy rates:…

Bill Nye on masks, with a map and some props
Talking about the effectiveness of masks on TikTok, Bill Nye uses a map…
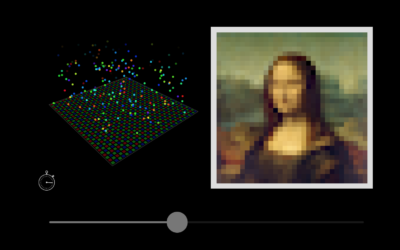
Interactive explainer for how cameras and lenses work
We use our cameras all of the time, and it almost seems like…
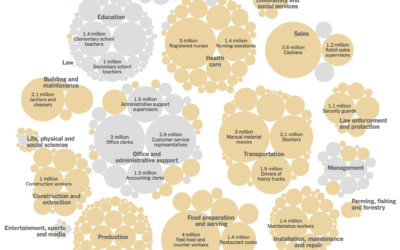
Defining “essential worker” to distribute vaccine
Matthew Conlen, in an article by Abby Goodnough and Jan Hoffman for NYT,…
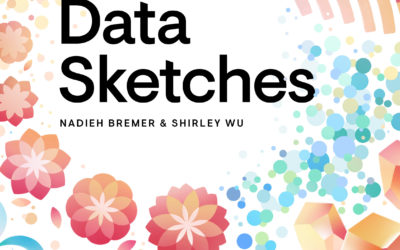
Data Sketches, the book
Data Sketches was a one-year visualization collaboration between Nadieh Bremer and Shirley Wu…
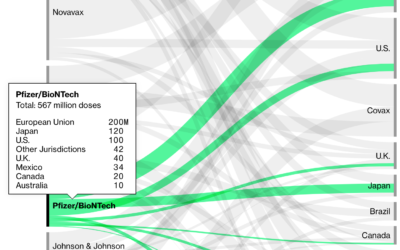
Vaccine contracts
Bloomberg is tracking nine coronavirus vaccines around the world. In addition to the…
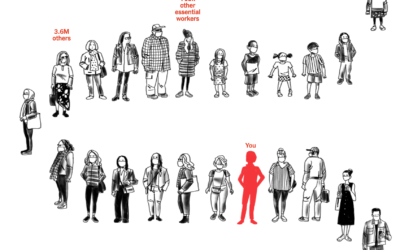
Your place in the vaccine line
Using estimates from the Surgo Foundation and Ariadne Labs, Stuart A. Thompson for…
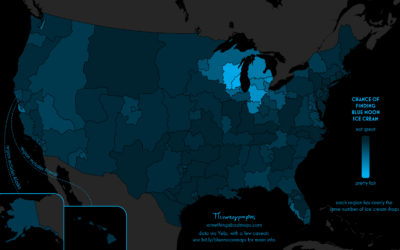
Searching for Blue Moon ice cream
Daniel Huffman grew up with an ice cream flavor called Blue Moon. Where…
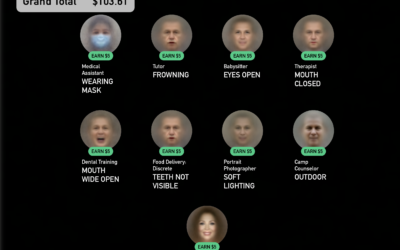
A game where you get to be a faceworker and mess with an AI system
Kyle McDonald, in collaboration with Greg Borenstein, Evelyn Masso, and Fei Lui, made…