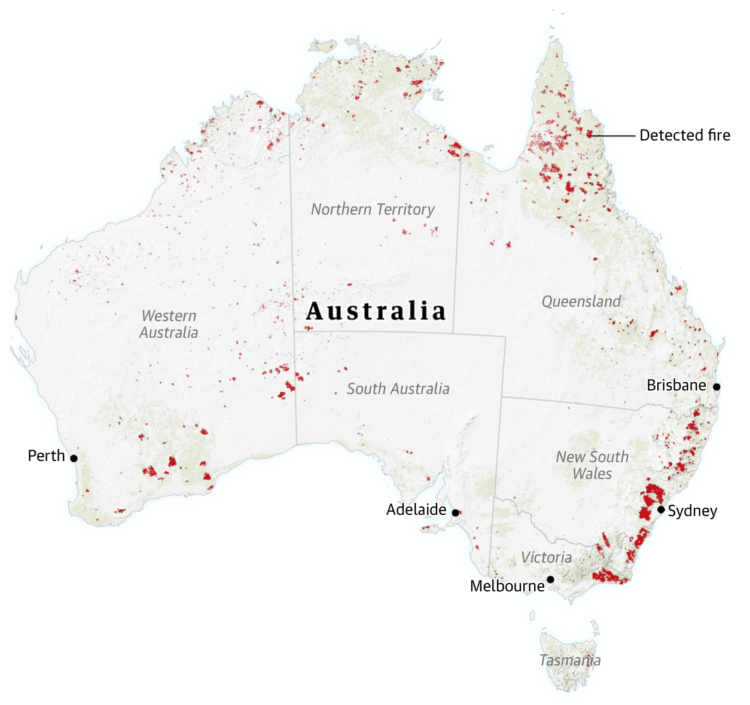
For The Guardian, Niko Kommenda and Josh Holder provide a visual guide to the bushfires in Australia:
Satellite data from Nasa showed a stark increase in the number of fire detections in November and December compared with previous years. Satellites detect fire “hotspots” by measuring the infrared radiation emitted by the blazes.
In previous years, between 2,000 and 3,000 such hotspots were recorded each December in the south-east, while in 2019 the number reached 227,000.
There’s an animated time series chart that changes the range of the y-axis, which I think is a good way to demonstrate the scale of the current fires.


 Visualize This: The FlowingData Guide to Design, Visualization, and Statistics (2nd Edition)
