Visualization
Showing the stories in data through statistics, design, aesthetics, and code.
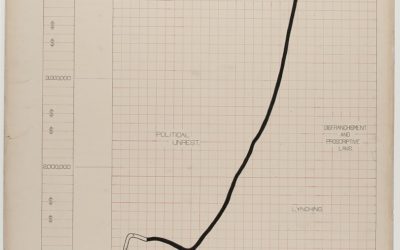
Visualizing black America in 1900
The visualization work of W.E.B. Du Bois and his students has been on…
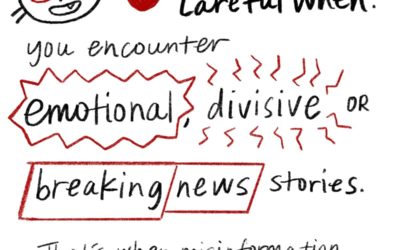
A comic on spotting misinformation
There’s a lot of misinformation passing through the internets right now. A lot.…
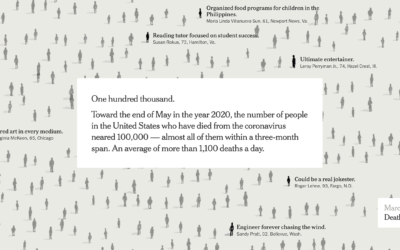
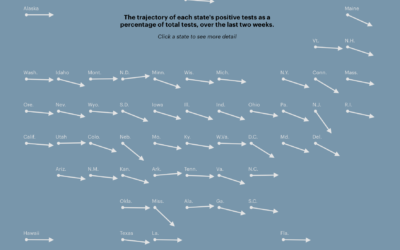
54 ways coronavirus changed the world
The coronavirus has changed everything. Larry Buchanan, for The New York Times, goes…
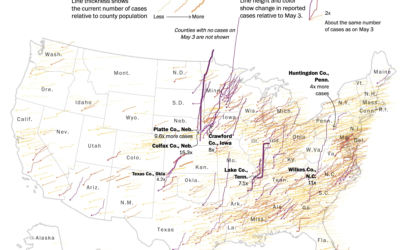
Map shows increasing confirmed cases in rural areas
This map by Tim Meko for The Washington Post uses time series lines…
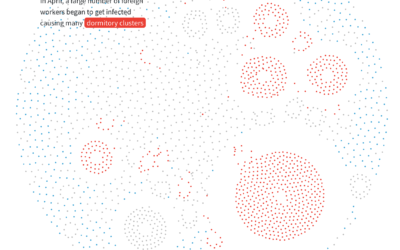
Anatomy of an outbreak
For Reuters, Manas Sharma and Simon Scarr animated a coronavirus outbreak in Singapore…

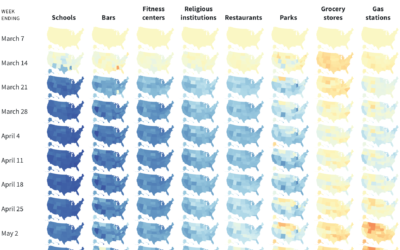
Moves towards reopening the country
Using anonymized cellphone data from SafeGraph, Reade Levinson and Chris Canipe for Reuters…
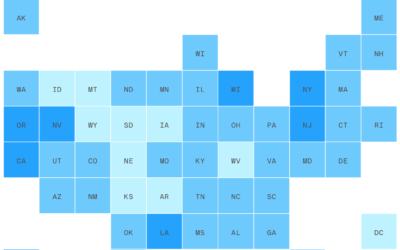
Reopening states and how they currently measure up
States are reopening. Some seem ready, and some less so. Lena V. Groeger…
Households that lost income
This straightforward grid map by Danielle Alberti for Axios shows the percentage of…
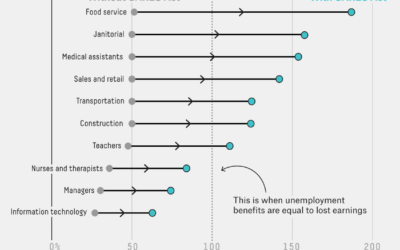
Where unemployment benefits are higher than lost wages
Economists at the University of Chicago analyzed unemployment benefits from the CARES act…
LEGO normal distribution animation
Let’s just animate all statistical concepts with LEGO from now on:
My daughter…
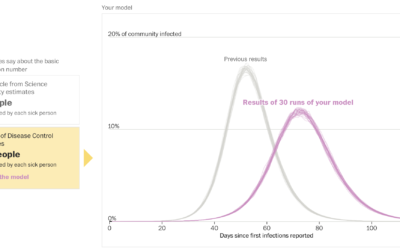
How experts use disease modeling to help inform policymakers
Harry Stevens and John Muyskens for The Washington Post put you in the…
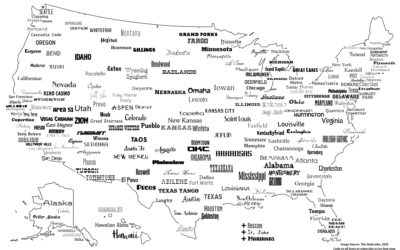
Map shows US typefaces named after cities in their geographic location
For The Statesider, Andy Murdock wondered how many typefaces are named after American…
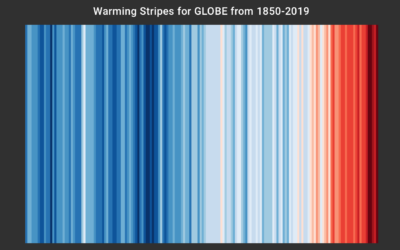
Global warming color stripes, as decorative conversation starter
Ed Hawkins, who you might recognize from charts such as spiraling global temperature…

Climate change displayed, with shower tiles
Based on a chart by Ed Hawkins, the shower wall of Gretchen Goldman…
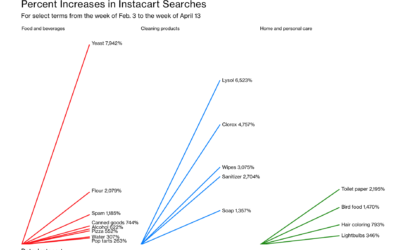
Change in Instacart searches after the coronavirus
For Bloomberg, Ellen Huet and Lizette Chapman reported on the jolt for Instacart…