Visualization
Showing the stories in data through statistics, design, aesthetics, and code.
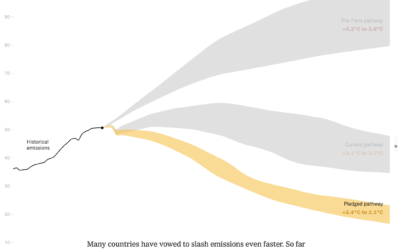
Bend the emissions curve
There has been progress since the Paris climate agreement in 2014, but there’s…
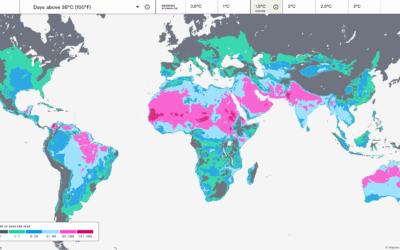
Mapping the probable heat around the world
Earth is getting warmer, and the previously abstract concept seems to grow more…
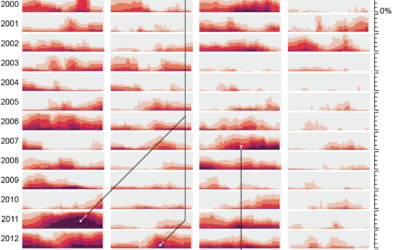
Drought extent by region
For Scientific American, Cédric Scherer and Georgios Karamanis charted drought extent by region…
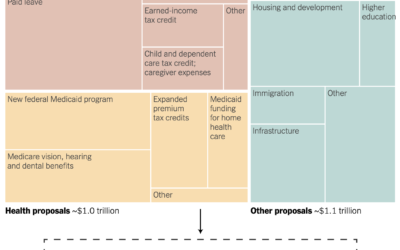
Spending bill in a treemap box
Margot Sanger-Katz and Alicia Parlapiano for NYT’s The Upshot broke down a Democrat…
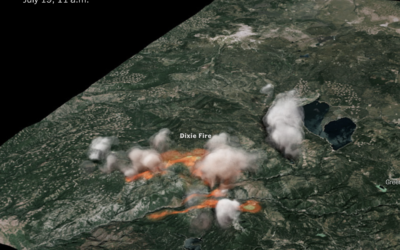
3-D rendering of Dixie fire smoke clouds
The New York Times used radar data to create a 3-D model of…

A view from the Moon’s south pole
[arve url=”https://www.youtube.com/watch?v=aD1OQ9UBwuU” loop=”no” muted=”no” /]
NASA Goddard visualized the point of view from…
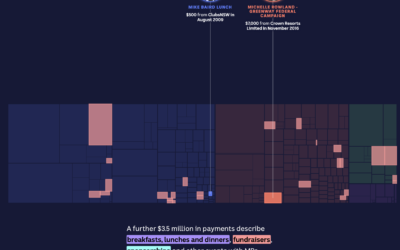
Treemap tour of political donations
The Digital Story Innovation Team for ABC News in Australia looked at political…
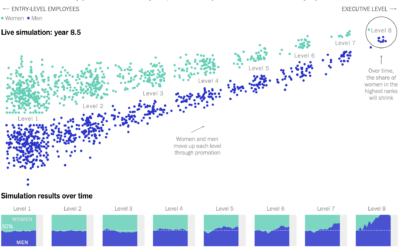
Simulating how just a little gender bias in the workplace can lead to big effects up the chain
Yuhao Du, Jessica Nordell, and Kenneth Joseph used simulations to study the effects…

How the 3-point line changed basketball
[arve url=”https://www.youtube.com/watch?v=2p3NIR8LYoo” loop=”no” muted=”no” /]
Vox shows how the 3-point line is “breaking”…

Possible cheating seen in a scatterplot
When plotting Russian election results, a structured grid patterns appear. From The Economist:…

A data visualization magazine
Nightingale is a publication from Data Visualization Society that offers more depth for…
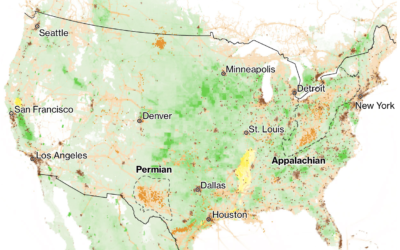
Reducing methane to slow climate change
We often hear about increased CO2 in the context of global warming. Hayley…
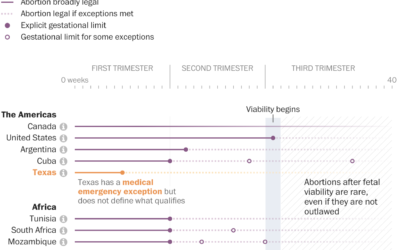
Comparing abortion limits in the U.S. against other countries
The Washington Post, in an effort that I’m sure took more energy and…
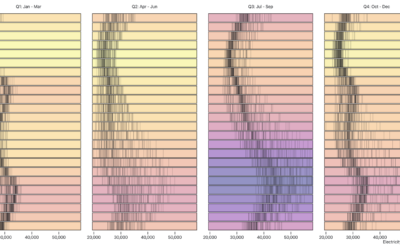
Visualizing time-based data
Zan Armstrong, Ian Johnson, and Mike Freeman for Observable wrote a guide on…
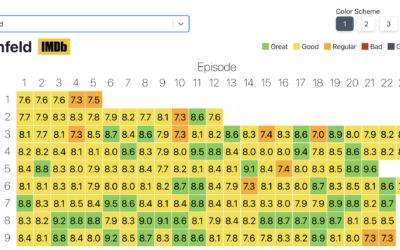
Heatmap of average IMDb ratings for all the shows
Inspired by a graphic on Reddit, Jim Vallandingham expanded the format for all…

How Facebook disappeared from the internet
Cloudflare describes how things looked from their point of view the day that…

Visual guide for protecting your home from wildfire
Aaron Steckelberg and Tik Root for The Washington Post provide a visual guide…