Visualization
Showing the stories in data through statistics, design, aesthetics, and code.
Pulp Fiction timeline
In case you were confused by the Pulp Fiction storyline, dehahs has plotted…
Overhaul of New York subway map
The ever-popular New York subway map is getting some work done, and will…
Iraq and Afghanistan casualities, home and away
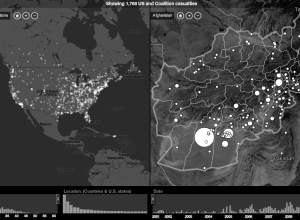
In a collaboration between CNN and Stamen Design, Home and Away offers a…
Current tracks and visualizes memes
It’s not easy keeping up with what’s going on around the Web. Trending…
Elastic Lists code open-sourced
Moritz Stefaner, whose work we’ve seen a few times here on FD, just…
World atlas of Flickr geotaggers is maptastic
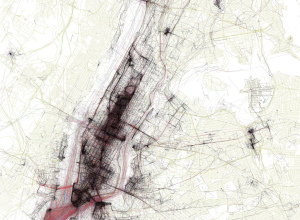
In a different look to the let’s-map-geotagged-photos idea, photographer Eric Fischer maps picture…
Map of where toursists flock
Bluemoon Interactive, a small codeshop, maps touristiness, based on uploads to Panoramio, a…
Most influential people on Twitter – Cosmic 140
Information Architects just released their annual Web Trends Map, but it’s not about…
Fake filming locations of Paramount Studios
This might shock you, but many movies are not filmed on location. Yeah.…
Tour of advanced visualization techniques
Jeffrey Heer, Michael Bostock, and Vadim Ogievetsky provide a good overview of some…
Twitwee the Twitter cuckoo clock
I love it when data, or in this case, tweets, finds itself in…
Senate and House races are on
I’m not proud of this, but I know very little about what’s going…
Design of Frank Lloyd Wright’s Masterpiece
In 1934, American architect Frank Lloyd Wright designed Fallingwater, a house built partly…
Facebook privacy options untangled
People are up in arms about Facebook’s new privacy policies, partly because some…
What America spends on food and drink
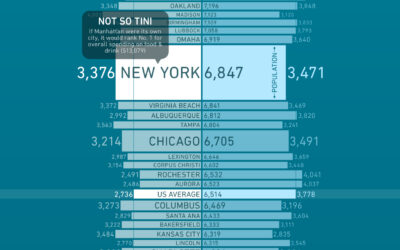
How much more (or less) money do you spend on groceries than you do on dining out? Bundle, a new online destination that aims to describe how we spend money, takes a look at the grocery-dining out breakdown in major cities.
Interview: Fernanda Viégas and Martin Wattenberg
Andrew interviews Fernanda and Martin about their new venture Flowing Media, visualization, and their amazing taste in adjectives.
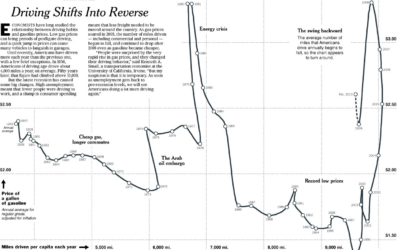
Driving habits and gas prices shift into reverse
Hannah Fairfield of the New York Times looks at driving habits and gas…

