Visualization
Showing the stories in data through statistics, design, aesthetics, and code.
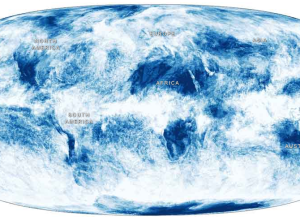
A year of global cloud coverage →
Jonathan Corum for the New York Times mapped cloud coverage from April 2011…
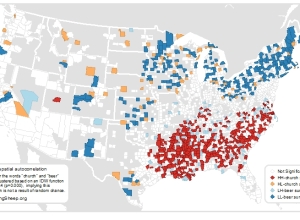
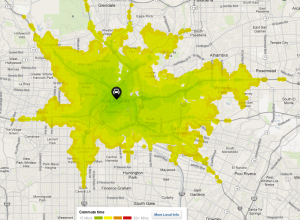
Beer versus church mapped →
The geographers at Floatingsheep are at it again, this time comparing tweets that…
Age range of US Olympic athletes, by sport
The Washington Post has a fun piece that compares your age to that…

The Higgs Boson explained by PhD Comics
Don’t know what the Higgs Boson is (or even how to pronounce it)?…
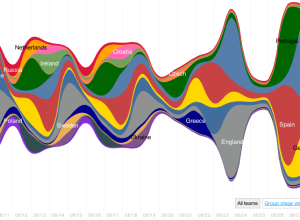
A graphical summary of Euro 2012 on Twitter
Nicolas Belmonte, a data visualization scientist at Twitter, visualized the change in tweet…
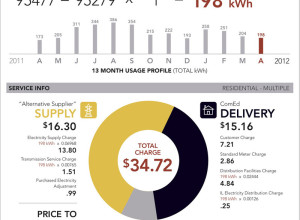
Electricity bill redesigned
The electricity bill (or all utility bills, really) haven’t changed much over the…

The Louis C.K. pain chart
Vulture illustrated the subtle changes in Louis C.K.’s face to express varying levels…
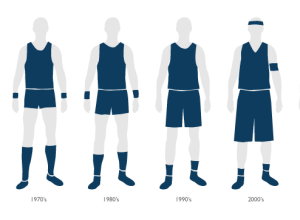
Growth of the basketball uniform
In the 1960s, the basketball uniform was about small, tight shorts and form-fitting…
Jeff Heer Interview →
Worth listening to whenever he talks visualization…
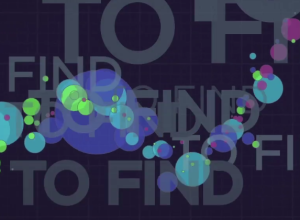
Infographic essay on the meaning of life
Information video designer Marco Bagni abstracted the meaning of life in his short…
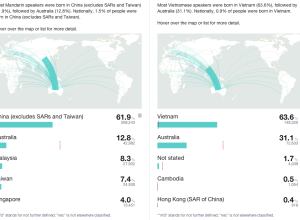
Side-by-side comparisons for Australian Census
Last week, Australia released data for their 2011 Census. Small Multiples, in collaboration…
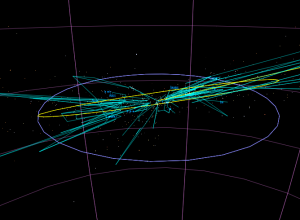
Stars in the zodiac constellations, from Earth and space
While we’re on the subject of stars, developer Riley Davis modeled the ones…

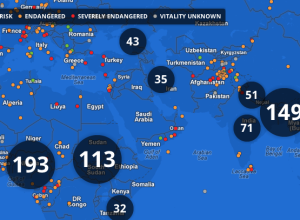
Endangered languages project
Google, in collaboration with Vizzuality, are trying to catalog endangered languages before they…
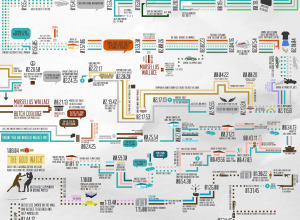
Pulp Fiction presented in chronological order
Smith hopes to put it print. Currently in Kickstarter mode.…

857 empty desks on National Mall used to represent high school drop-outs
As part of their campaign to prioritize education and get presidential candidates talking…