Visualization
Showing the stories in data through statistics, design, aesthetics, and code.
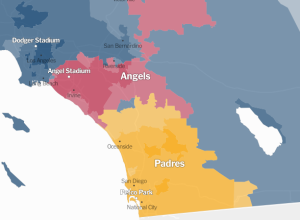
Detailed map of baseball fandom →
For the past couple of sports seasons, Facebook mapped the most liked team…
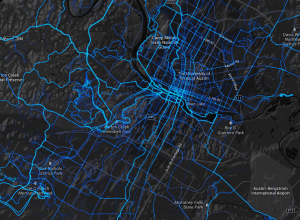
Where people bike and run, worldwide
Remember those running maps I made with limited data from RunKeeper? Strava, which…
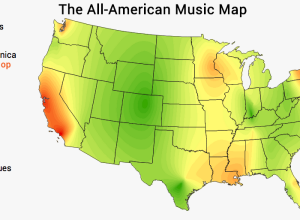
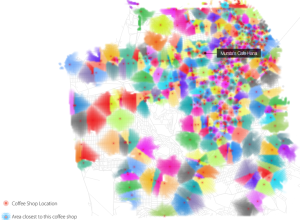
Music preference by region
Movoto mapped music preference for various genres, across the United States.
We calculated…
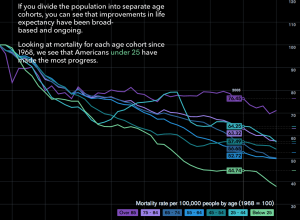
How people die in America
Matthew Klein for Bloomberg View explored mortality in America through a slidedeck of…
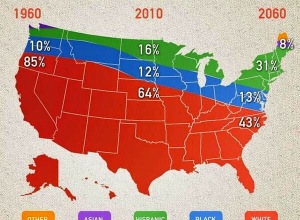
Weird stacked area map thing
This chart-map-looking thing from Nightly News is making the rounds, and it’s not…
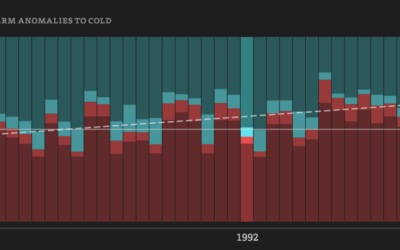
Five decades of warm and cold weather anomalies
This year’s polar vortex churned up some global warming skeptics, but as we…
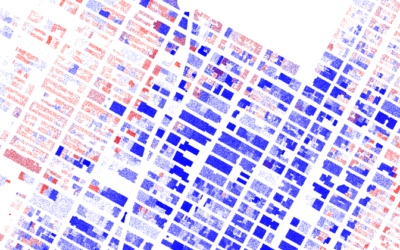
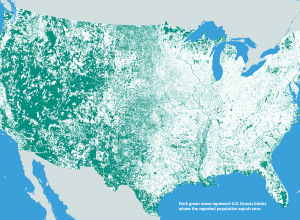
High-detail maps with Disser
Open data consultancy Conveyal released Disser, a command-line tool to disaggregate geographic data…
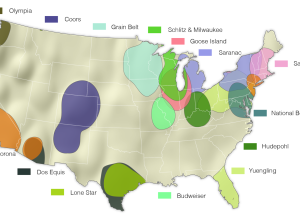
Regional macrobrews
FloatingSheep pointed their Twitter geography towards beer (and wine).
From Sam Adams in…
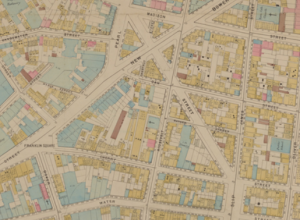
Open access to 20,000 maps from NYPL
The New York Public Library announced open access to 20,000 maps, making them…

Planetary layer cake
From Cakecrumbs, a product that helps you learn while you eat: planetary layer…

Exponential water tank
Hibai Unzueta, based on a paper by Albert Bartlett, demonstrates exponential growth with…
Centuries of European border changes
The Centennia Historical Atlas is a program that shows you border changes in…
Reconstructing Google Streetview as a point cloud
Patricio Gonzalez Vivo, an MFA Design & Technology student, scraped depth from Google…