Projects
Graphics by Nathan Yau, borne out of everyday curiosities, learning experiments, and mild insomnia.
your.flowingdata: Collect Data About Yourself via Twitter
As many of you know, I’ve been working on a project that lets…
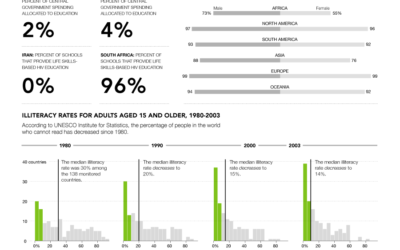
Progress: A Graphical Report on the State of the World
You might recall that the United Nations Statistics Division launched UNdata about one…
Mapping and Animating Growth of Target Across United States
After I produced a map that shows the growth of Walmart, there were…
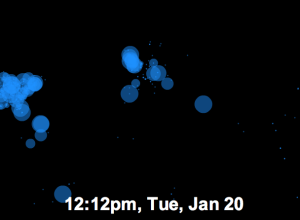
Visualizing Twitter as Barack Obama Became the 44th President
On Tuesday, January 20, 2009 at 12pm, Barack Obama officially became the 44th…
Discover Your Future for 2009 – CookieSays Fortunes
First off, happy new year! I’m back from my short hiatus from blogging…
Understand Your Behaviors with Twitter – Testers Needed
I started tracking what I eat and my weight using Twitter in an…
Tracking Weight and What You Eat with Twitter
I’m sure this will come as no surprise to all of you, but…
Code For Walmart Growth Visualization Now Available
It took me three months to do it, but the code to visualize…

40 Essential Tools and Resources to Visualize Data
One of the most frequent questions I get is, “What software do you…
United States Poverty Rates From 1980 to 2007
Thousands of bloggers are taking the time to discuss a single topic today…
How to Create a Real-Time Web Traffic Map for Your Site
I just released Visitr. Now you can create a real-time web traffic visualization for your own site or blog.

Watch the Rise of Gasoline Retail Prices, 1993 – 2008
"What do the data look like for gasoline prices?" The prices go up, then down, then up, down, up...
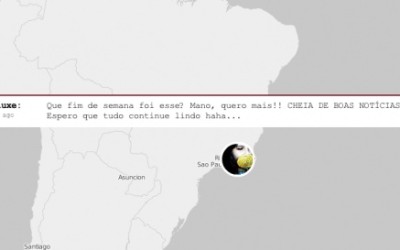
Watching Our Twitter World – twittervision Redux
See what people are tweeting around the world 24/7. What are you doing right now?
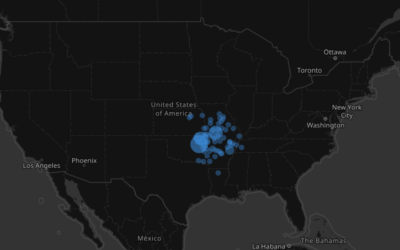
Watching the Growth of Walmart Across America, Interactive Edition
The animated map starts slow with the first location in Arkansas in 1962 and then spreads like a wildfire. When did your nearest Walmart open?
What Do People Want to Do With Their Lives?
43 Things is a goal-setting community where people set goals, cheer each other…