Guides
Tips and suggestions for working with and designing with data.
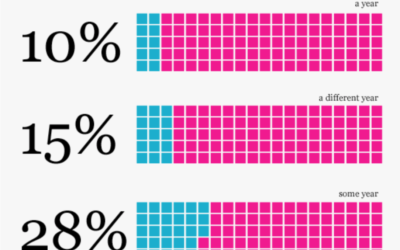
Show Me Something Good
Visualization is a great way to explain and describe data to people who…
Resources for Getting Started with R
R, the open source statistical software environment, is powerful but can be a…
The Don’ts of Infographic Design
Smashing Magazine offers advice on the dos and don'ts of infographic design, but they forgot to include the former. It's as if I wrote a fake post and someone mistook it for a serious guide.
5 misconceptions about visualization
Last month, I had the pleasure of spending a week at the Census…
Why learning code for data is worthwhile
There are lots of tools that have come out in the past couple…
Graph Design Rule #2: Explain your encodings
This is part two in a seven-part series on basic rules for graph…
Graph Design Rule #1: Check the data
Now that we’ve covered the 7 basic rules to graph design, it’s time…
7 Basic Rules for Making Charts and Graphs
Charts and graphs have found their way into news, presentations, and comics, with…
The Boom of Big Infographics
Big information graphics have been around for a long time. They’ve come in…
Think Like a Statistician – Without the Math
I call myself a statistician, because, well, I'm a statistics graduate student. However, the most important things I've learned are less formal, but have proven extremely useful when working/playing with data.
11 Ways to Visualize Changes Over Time – A Guide
Deal with data? No doubt you've come across the time-based variety. This is a guide to help you figure out what type of visualization to use to see that stuff.
9 Ways to Visualize Proportions – A Guide
With all the visualization options out there, it can be hard to figure…
30 Resources to Find the Data You Need
Let’s say you have this idea for a visualization or application, or you’re…
What Visualization Tool/Software Should You Use? – Getting Started
Are you looking to get into data visualization, but don’t quite know where…

