Age and Occupation
Whether it’s because of experience, physical ability, or education level, some jobs tend towards a certain age of worker more than others. For example, fast food counter workers tend to be younger, whereas school bus drivers tend to be older.
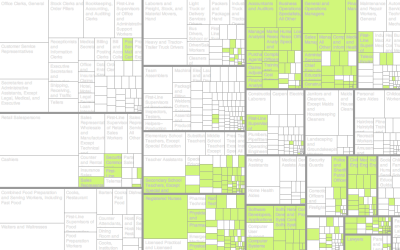
These are the age ranges for 529 jobs. Search for your job or look at others.
This is based on data from the American Community Survey for 2018 and 2019, downloaded via IPUMS.
The middle ranges represent 25th to 75th percentile, or the interquartile range (IQR). The median is in the middle. The outer values and the minimums and maximums within 1.5 times the IQR. It’s like a compact box plot.
Chart Types Used


Become a member. Support an independent site. Get extra visualization goodness.
See What You Get