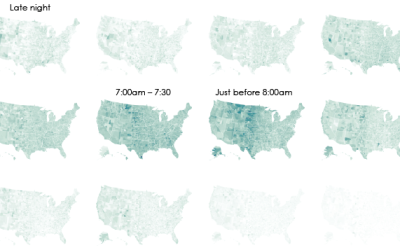
Cycle of Many, a 24-hour snapshot for a day in the life of Americans

This is a 24-hour snapshot for a day in the life of Americans. Each ring represents an activity with a color. More dots means a greater percentage of people doing the respective activity during a certain time of day.
If you start at the top of the circle, you’ll be at 9:00am when most people who work are already working. Move clockwise, and you see the flows of the day. People break for lunch at noon, get off work around 5:00pm, shift to dinner and then relax. Most people are sleeping by midnight but a small percentage of people are work at night.
Focus on the inside rings versus the outer rings for a rough comparison between work life and home life, each with its own responsibilities.
Source
Chart Type Used

Become a member. Support an independent site. Get extra visualization goodness.
See What You Get