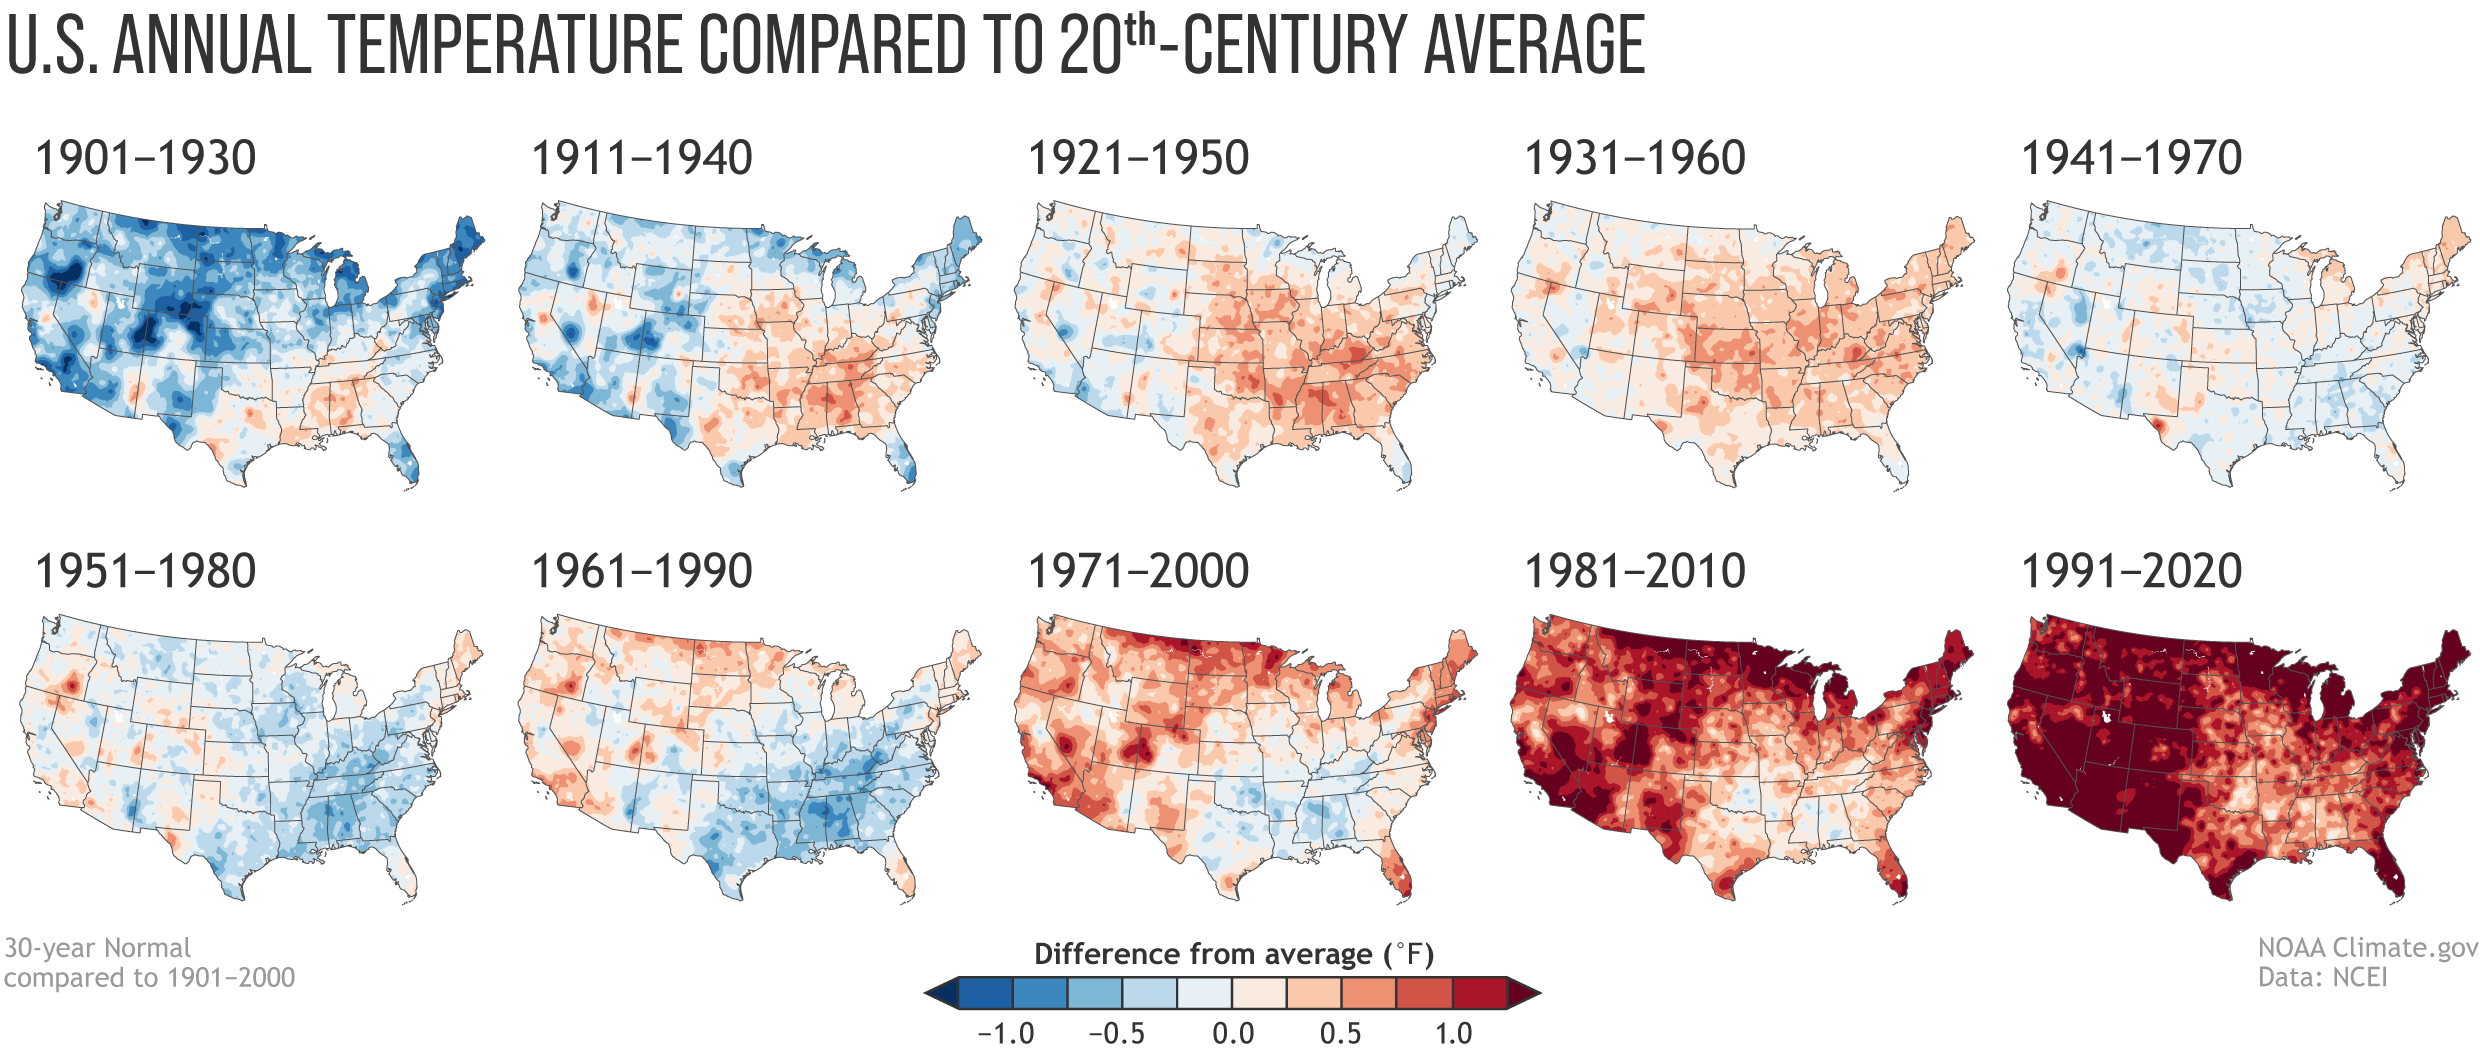
Climate normals mapped over time
May 13, 2021

Every decade the National Oceanic and Atmospheric Administration releases climate normals to provide a baseline to compare current weather against. NOAA just released the estimates for 1991 to 2020. As you might expect, and shown in the maps above, it’s getting hotter.

Become a member. Support an independent site. Make great charts.

See What You Get

Favorites

A Day in the Life of Americans

I wanted to see how daily patterns emerge at the individual level and how a person’s entire day plays out. So I simulated 1,000 of them.

All the Household Types in the U.S.

No need to restrict ourselves to the most common types. There are thousands. Let’s look at all of them.

How to Spot Visualization Lies

Many charts don’t tell the truth. This is a simple guide to spotting them.

How We Spend Our Money, a Breakdown

We know spending changes when you have more money. Here’s by how much.