How Much Minimum Wage Changed in Each State
Minimum wage has increased over the years, but it’s changed by different amounts in different states at different times. Based on data collated by the U.S. Department of Labor, these are the shifts from 1968 to present.
You can find the historical data here, and there are quite a few footnotes, because as you might expect, not all states handle minimum wage in the same way.
In the original data, some states show a range for minimum wage. For example, states such as Minnesota, Montana, and Ohio set a lower minimum wage for smaller businesses. In these cases, I used the lower value.
Also, the dataset doesn’t include values for every year between 1968 to 2021. In these cases, I used a simple linear interpolation to get values for the missing years. This is not the most accurate approach, but I think it’s good enough to see where the thresholds are moving.
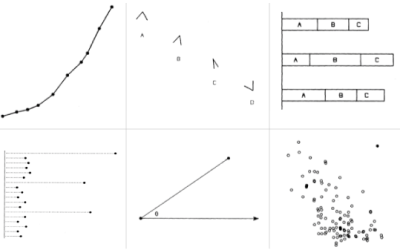
Chart Type Used

Become a member. Support an independent site. Get extra visualization goodness.
See What You Get