Brewing Multivariate Beer
I was toying around with the idea of multivariate beer, along the same lines as Data Cuisine. I wanted to represent county demographics with beer ingredients. The higher a value, say, population density, the more hops I use, or the higher the median household income the more of a particular grain.
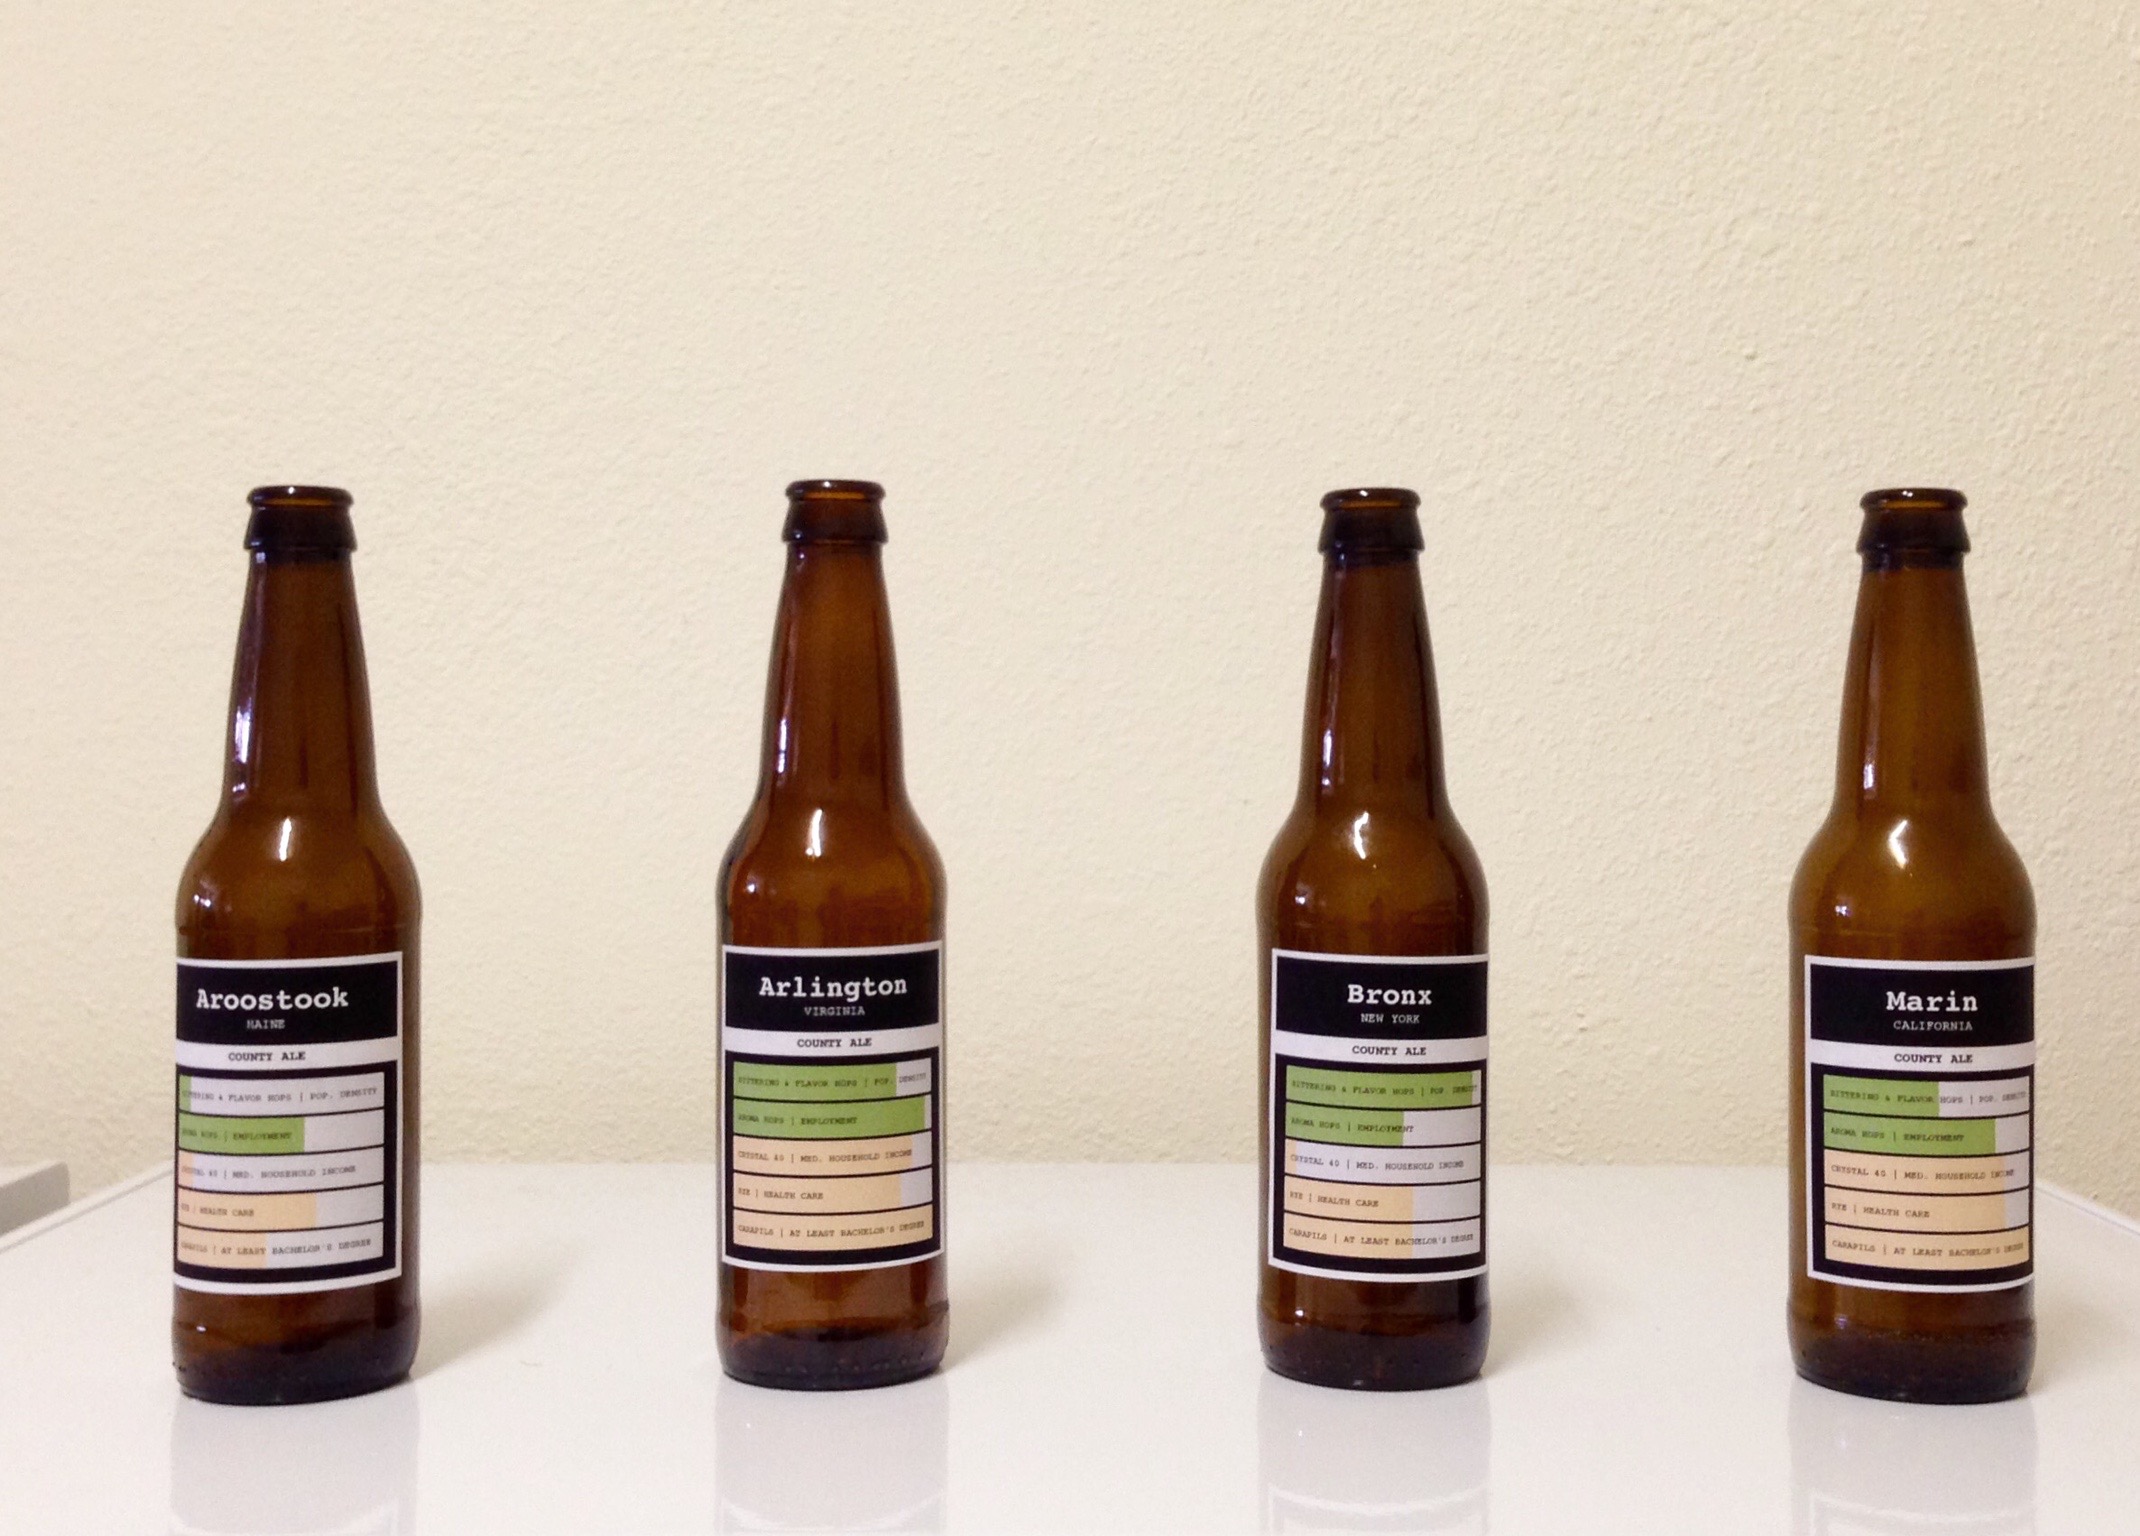
For contrast I brewed county ales for Aroostook, Maine (low population density), Arlington, Virginia (high median household income), Bronx, New York (high population density), and Marin, California (high education rate).
Could I taste and see the difference? In short, yes. But I’d adjust the recipe code and brewing process the next time around. Here’s how it went down.
The R script
I wrote a quick function in R that spits out basic recipes. Enter the county name and state, and you get a list of ingredients and suggestions on how to use them.
Download the code if you want to mess around with it.
Nothing too fancy. It uses data from the 2013 American Community Survey and translates county values to ingredient amounts. Here’s what I eventually settled on.
- Population density translates to total amount of hops. The more people in a county, the hoppier the beer tastes.
- Race percentages translate to the type of hops used. For example, a higher rate of white people means a higher percentage of the total hops (determined by population density) that are Cascade hops.
- Percentage of people with at least a bachelor’s degree translates to amount of Carapils grain, which contributes to head retention.
- Percentage of people with healthcare coverage translates to amount of rye, which adds a distinct spicy flavor.
- Median household income translates to amount of Crystal malt, which adds body and some color.
For example, here’s the recipe for Los Angeles County, California.
> make_recipe("Los Angeles", "California")

LOS ANGELES COUNTY ALE
-----------------------------
This recipe is for a 5-gallon batch.

Hop addition times decided by brewer. Suggestion: Continuous hopping every 10 minutes during a 60-minute boil. That's 0.8 ounces per interval, which includes the hop addition at the beginning of the boil.

Add half of aroma hops at flameout. Use the rest for dry-hopping.

HOPS
-----------------------------
Cascade: 1.5oz
Centennial: 0.4oz
Citra: 0.8oz
Warrior: 2.7oz
Magnum: 0.2oz
Cascade (for aroma): 1.4oz

GRAINS
-----------------------------
American 2-row: 12lbs (STATIC, for 5-gallon batch)
Carapils: 0.9lbs
Rye: 0.4lbs
Crystal40: 0.5lbs
The code also spits out some labels, which was more for fun than anything else. Oh wait, I’m brewing beer. This whole thing was fun.
Brewing process
I’m not an expert brewer by any sense of the word. My friend and I have brewed a little over fifty beers over the past few years, and some of them were pretty tasty, but this county experiment was different from a logistical standpoint.
First of all, we typically brew one beer at a time as a single five-gallon batch. That’s standard in homebrewing. For this project, we brewed four beers at the same time as one-gallon batches. So we had to keep track of four recipes, which means four sets of grains, hops, and times for when to drop in ingredients into each pot.
If you’re unfamiliar to brewing, you have a bunch of ingredients and you boil wort, which is basically water with fermentable grain sugars. In all-grain brewing, you grab the sugars yourself from a base grain. But to keep things simple, we used extract, which saves a few hours. The tradeoff is between convenience and freshness. That said, you can still make a decent brew with extract.
Anyways, that brings us to the specialty grains. These don’t provide fermentable sugars. Instead, they can provide head retention, add body and mouthfeel, change the taste, and change the color of the beer. The amounts were defined by the R script.

The grains all steep in a grain bag at the same time, so they combine in a single bowl for each county ale.
Hops on the other hand go in at different times, so we split them up accordingly. It turns out a muffin tin is perfect for this sort of thing. Each beer gets a column, and each row is a drop time.
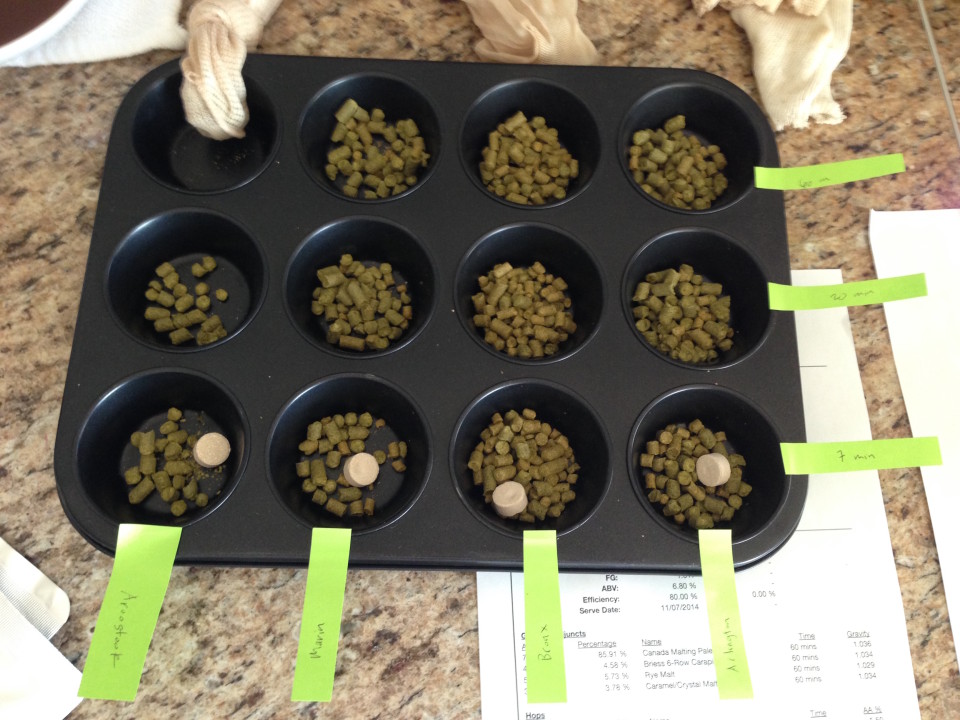
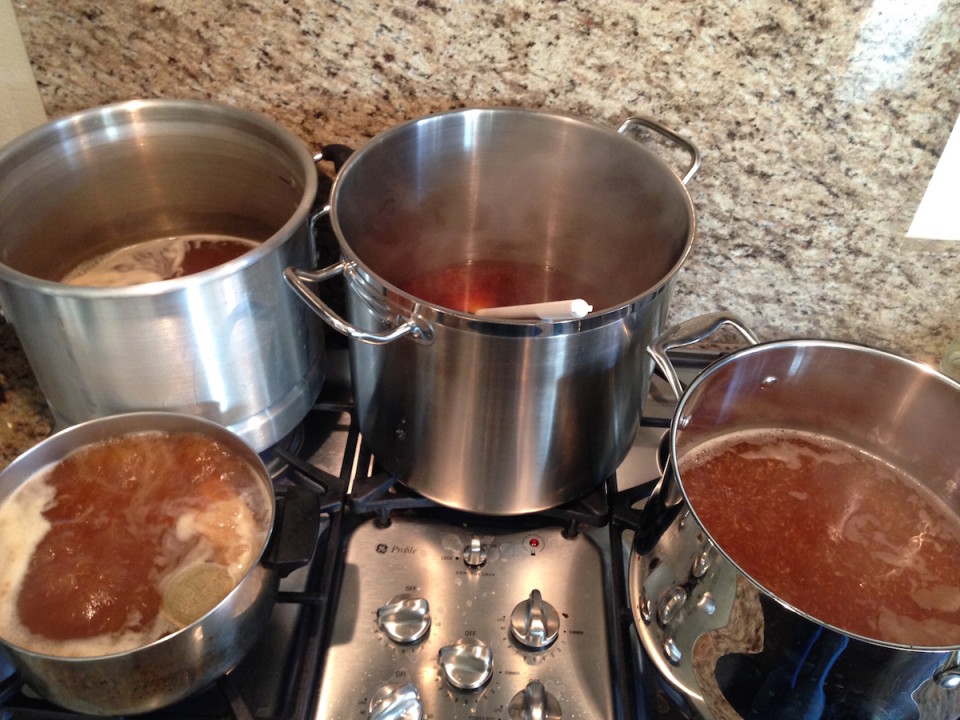
Then the boil, which proved to be a challenge. The burners on my stove vary in size, and the small burners in the back weren’t enough to keep the wort boiling strong. So I was rotating pots throughout the boil to keep each pot its fair share of heat. I amazingly did not mix everything the pots up. A diagram of my stove helped keep track.
After the boil and the wort cooled down, it went into one-gallon carboys. We pitched the yeast, waited a couple of weeks, and then bottled. You can kind of see a difference in color at this point, which is from the Crystal malt dictated by median household income.
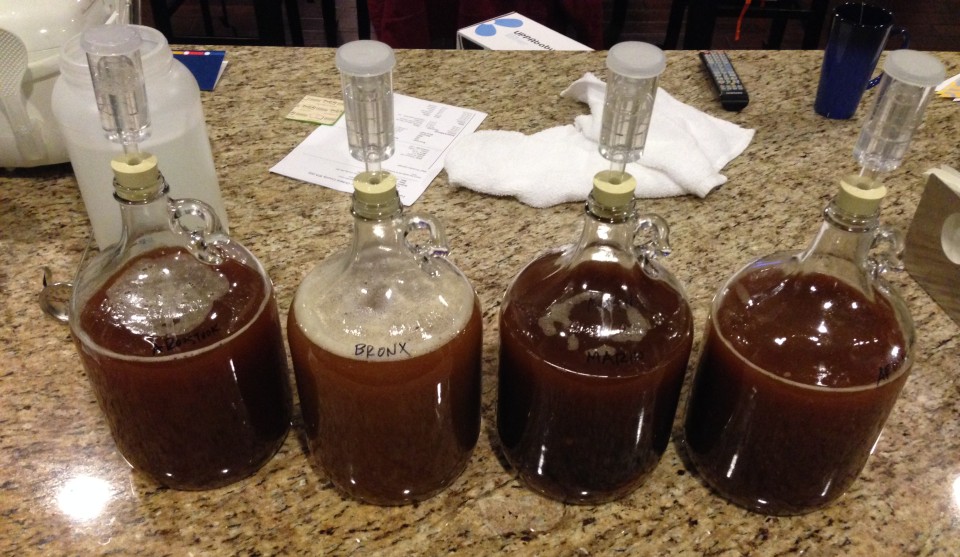
And then we waited another month for the beer to condition in the bottles.
The taste
The hardest about brewing is waiting for fermentation to finish. After a couple of months, we finally got to taste. Carbonated, didn’t smell infected, and smelled like beer. Always a good sign.
This is a glass of Aroostook County Ale.
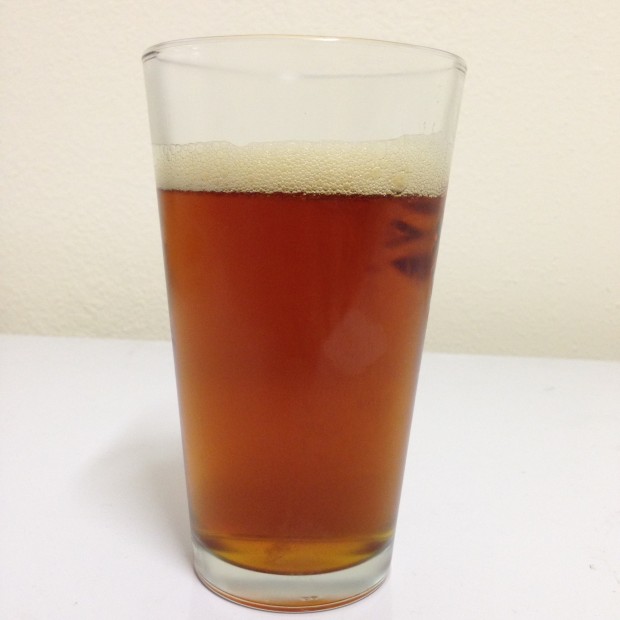
Unfortunately, the pictures I took of each beer didn’t come out great, and they all look about the same. But there were some clear differences.
- Aroostook was pretty mild all around. Not many hops or Crystal malt, which translates to low population density and median income.
- Arlington had a thick head, some aroma, and an obvious rye taste, which translates to high education rate, high employment, and high-ish healthcare coverage rate.
- Bronx was lighter in color and really hoppy in an unbalanced sort of way, which translates to low income and high population density. An unbalanced beer.
- Marin had a little bit of hop aroma with a dose of rye at the end.
For all four beers, it was hard to gauge head retention because they were so heavily carbonated.
Wrapping up
It was a fun and successful experiment. There were definite taste differences between the beers. Although I’m curious how I would fare in a blind taste test. I knew what beers I was drinking and how ingredients varied by specific metrics, but my friend had similar comments about taste without knowing what corresponded to what.
Most counties would taste really similar, and I think it would be tough to detect subtle differences. These counties were chosen specifically for their contrast. I’m curious if non-frequent beer drinkers would taste differences, as I’ve drank and brewed enough beer to know what I’m looking for.
Finally, would I do this again? Probably not. Brewing is a lengthy process, and if I’m gonna do it, I prefer to make a beer that I like a lot. These county ales were just okay in the taste department. I’m sure the recipe generator could be calibrated to make tastier beverages, but again, that’s quite the process.
I’m interested in trying this with other food and beverages that are quicker to make. Cocktails? Stew? Foods with distinct and separate flavors could be good. Like sandwiches. Or tacos. Salad. Visual differences would be more obvious.
Gonna keep experimenting.
Become a member. Support an independent site. Get extra visualization goodness.
See What You Get
