College Admission Rates for U.S. Schools Compared
A few years removed from applying to colleges, I wondered what admission rates are like these days. The United States Department of Education had the data. Below are rates for about 1,400 institutions that award at least a bachelor’s degree and have at least 500 undergraduates.
Compare Your College
Search for schools in the box below to see how selective they were for the 2022-2023 academic year.
Admission rates are self-reported by the schools, so the above doesn’t include every college, but most provide the information.
The California Institute of Technology had the lowest admission rate as the only school that reported under 3%. Harvard, Stanford, Columbia, and Massachusetts Institute of Technology rounded out the top five most selective.
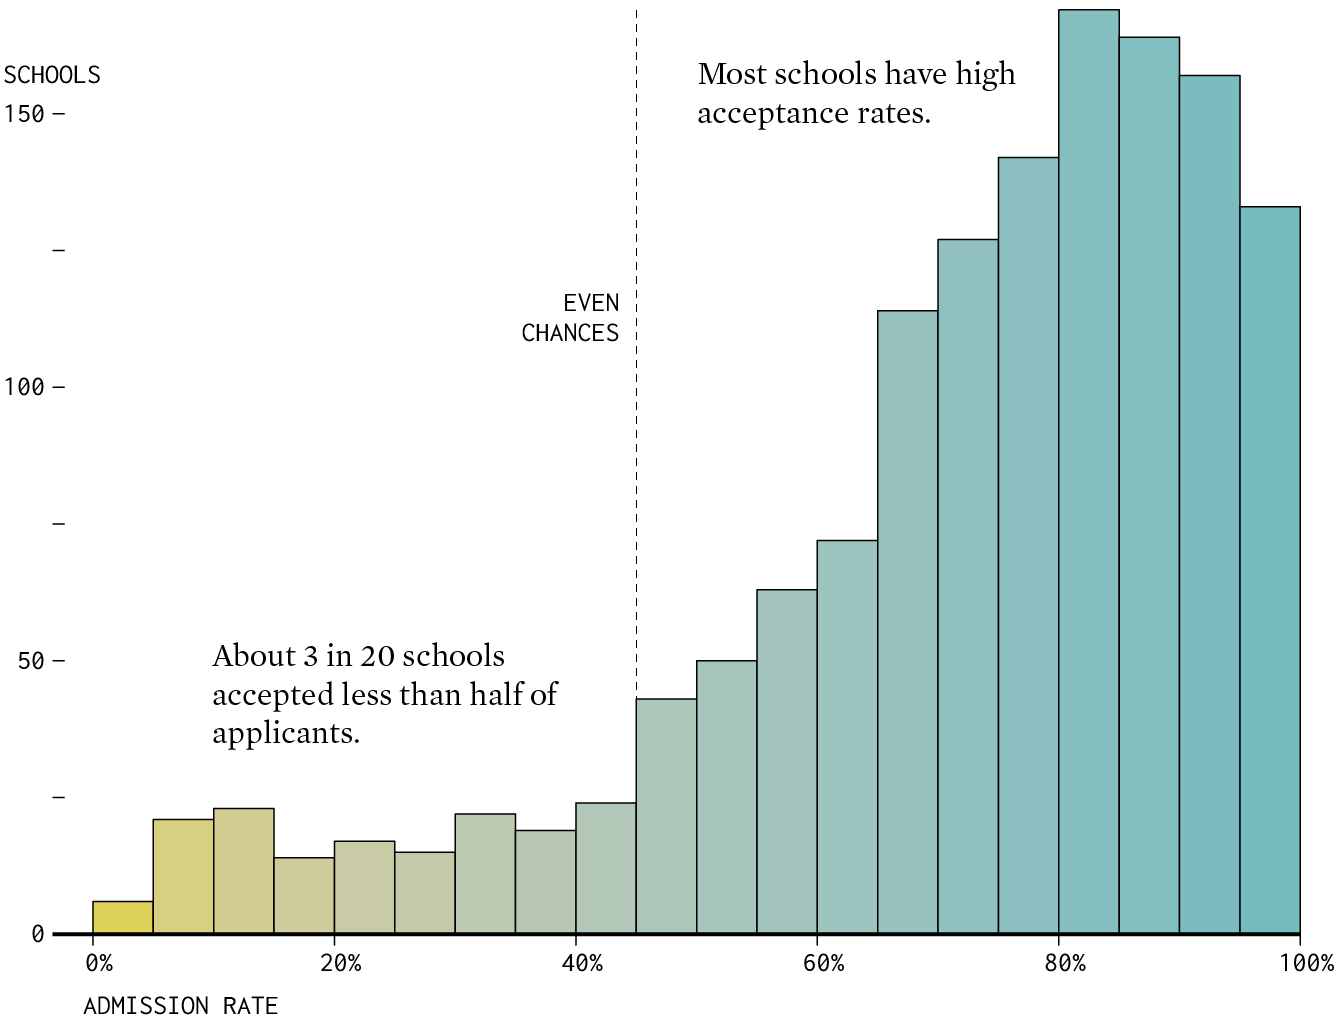
But just because you don’t get into a more selective school doesn’t mean you’re out of options. Most schools, as in 85% of them, accept more than half of applicants.
High Acceptance Rates are Common
Find success outside top colleges.

Notes
There were some small schools that had near-zero acceptance rates, but the data doesn’t include number of applicants, so it was hard to say if these schools were selective or just didn’t get many applications. Hence the 500-undergraduate cutoff.
The 2022-2023 came from the Department of Education’s College Scorecard.
I used R, D3.js, and Illustrator to analyze the data and make the charts above.
Become a member. Support an independent site. Make great charts.
See What You GetFlowingData is made possible by supporting members. Since 2007, I, Nathan Yau, a real person, have been analyzing and visualizing data to help more people understand and appreciate it in their everyday lives.
If you liked this or want to make similar data things, please consider supporting this small corner of the internet. You get unlimited access to visualization courses, tutorials, and extra resources. Thanks. — Nathan


