Renting vs. Owning a Home, by State

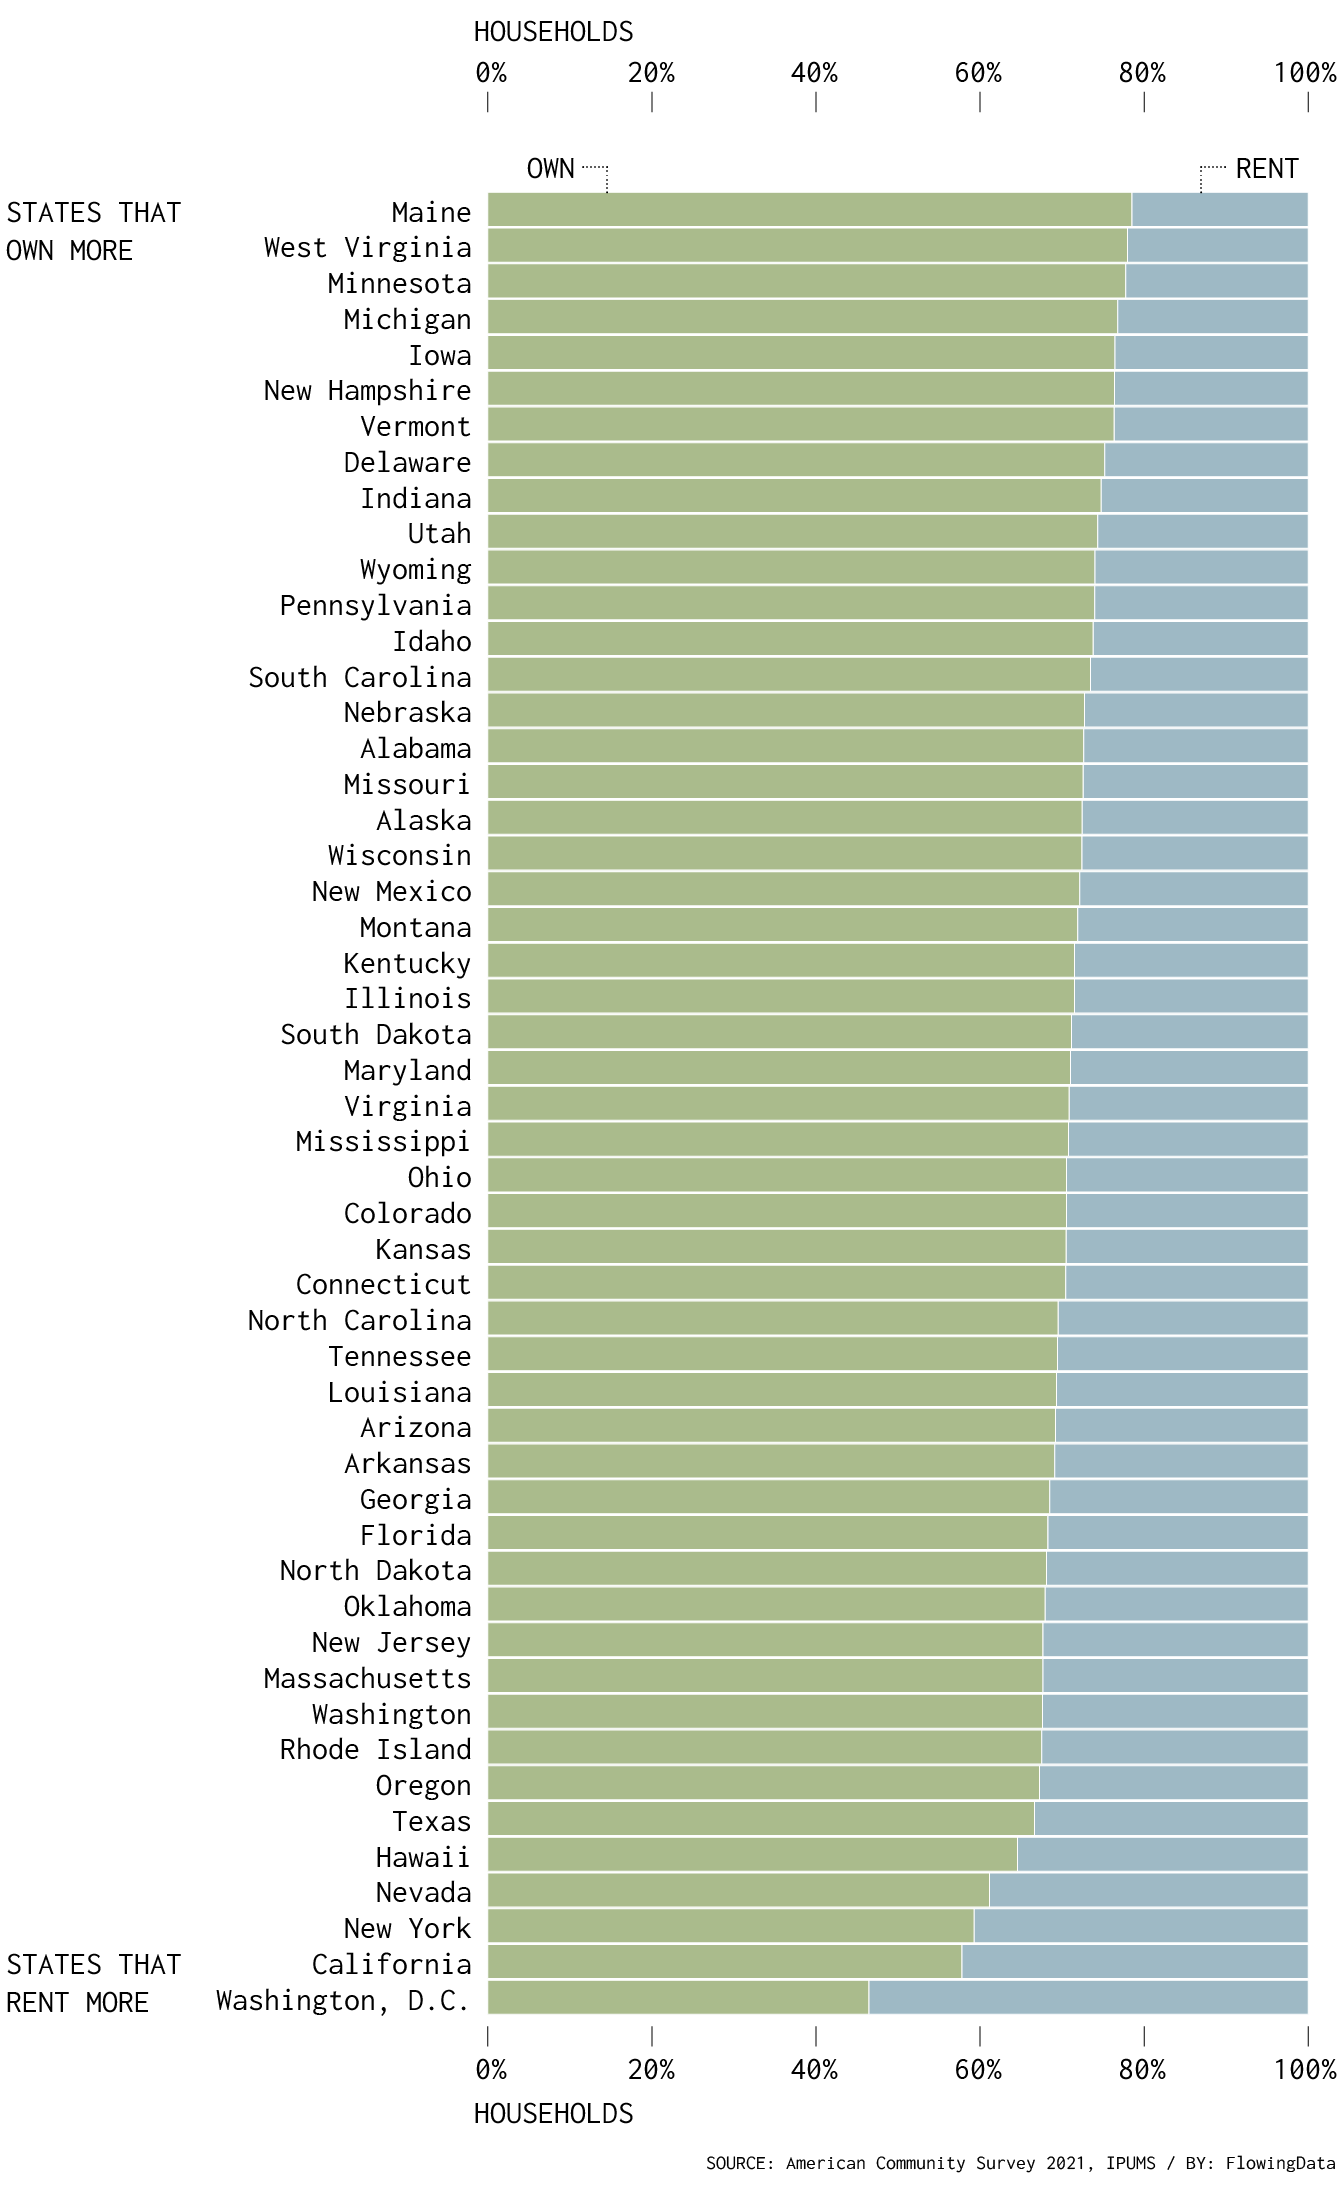
Among households in the United States, 68% are owned and 32% are rented, based on estimates from the American Community Survey in 2021. That breakdown isn’t uniform across the country though. In Maine, almost 80% of households are owned, whereas in California, less than 60% is owned. In Washington, D.C., it’s less than half. Here are the splits for each state.

Households that are owned and rented

Maine has the lowest renting rate. Washington, D.C. has the highest.

Own and rent by state  

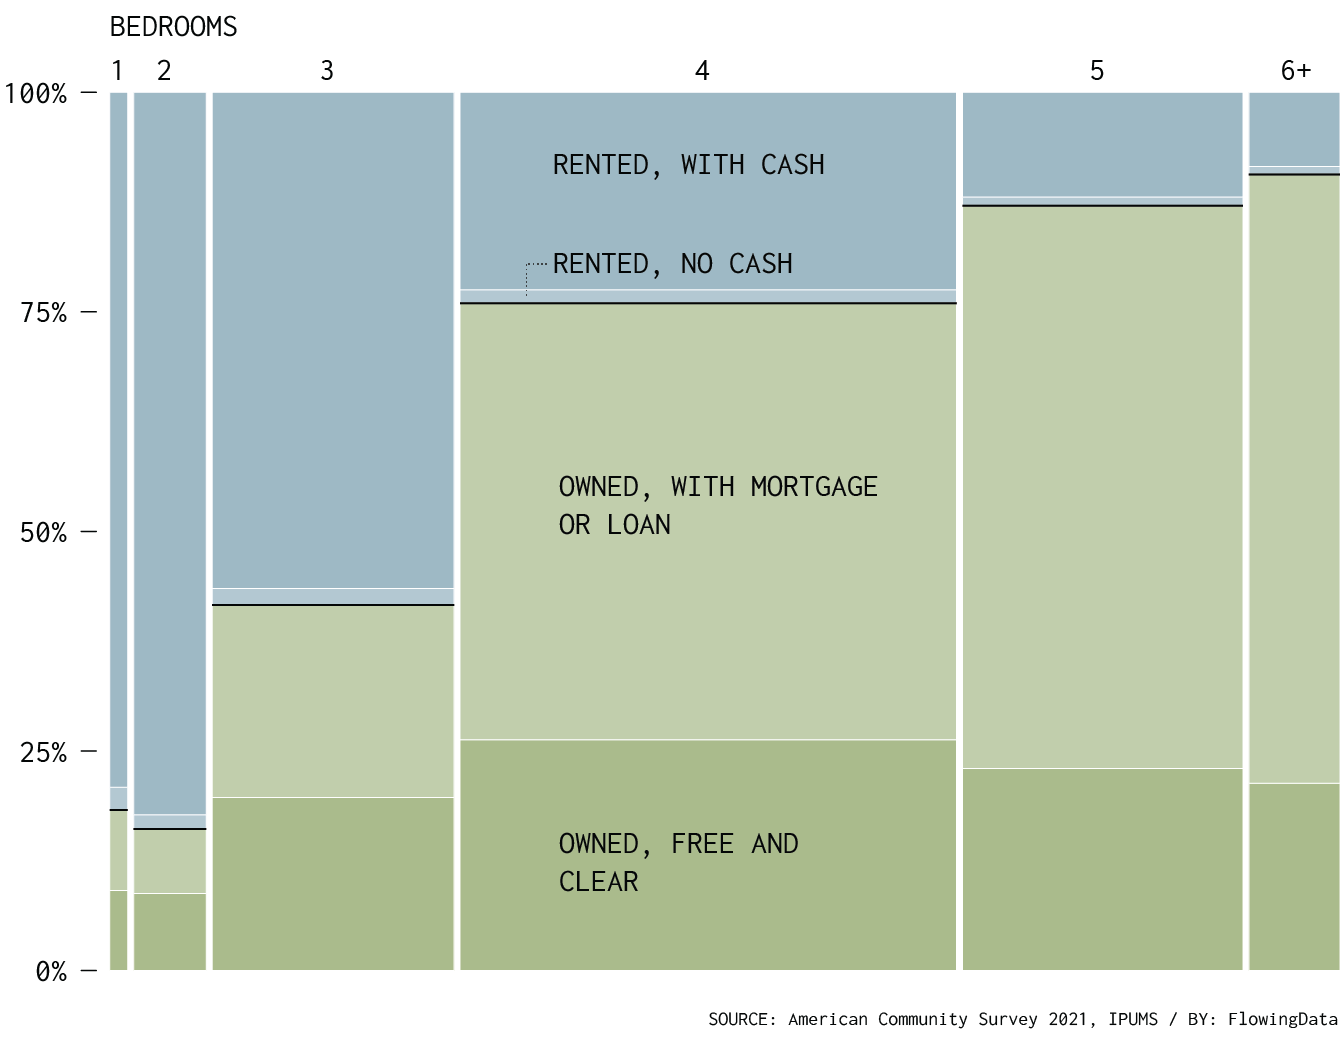
There’s a difference between owning a home outright and paying down a mortgage. The data offers sub-categories for renting and owning. The chart below also splits up households by number of bedrooms.

By Number of Bedrooms

Most people who “own” a home are paying down a mortgage or loan, and households with more rooms are less likely to have been paid off.

Own and rent by state and bedrooms  

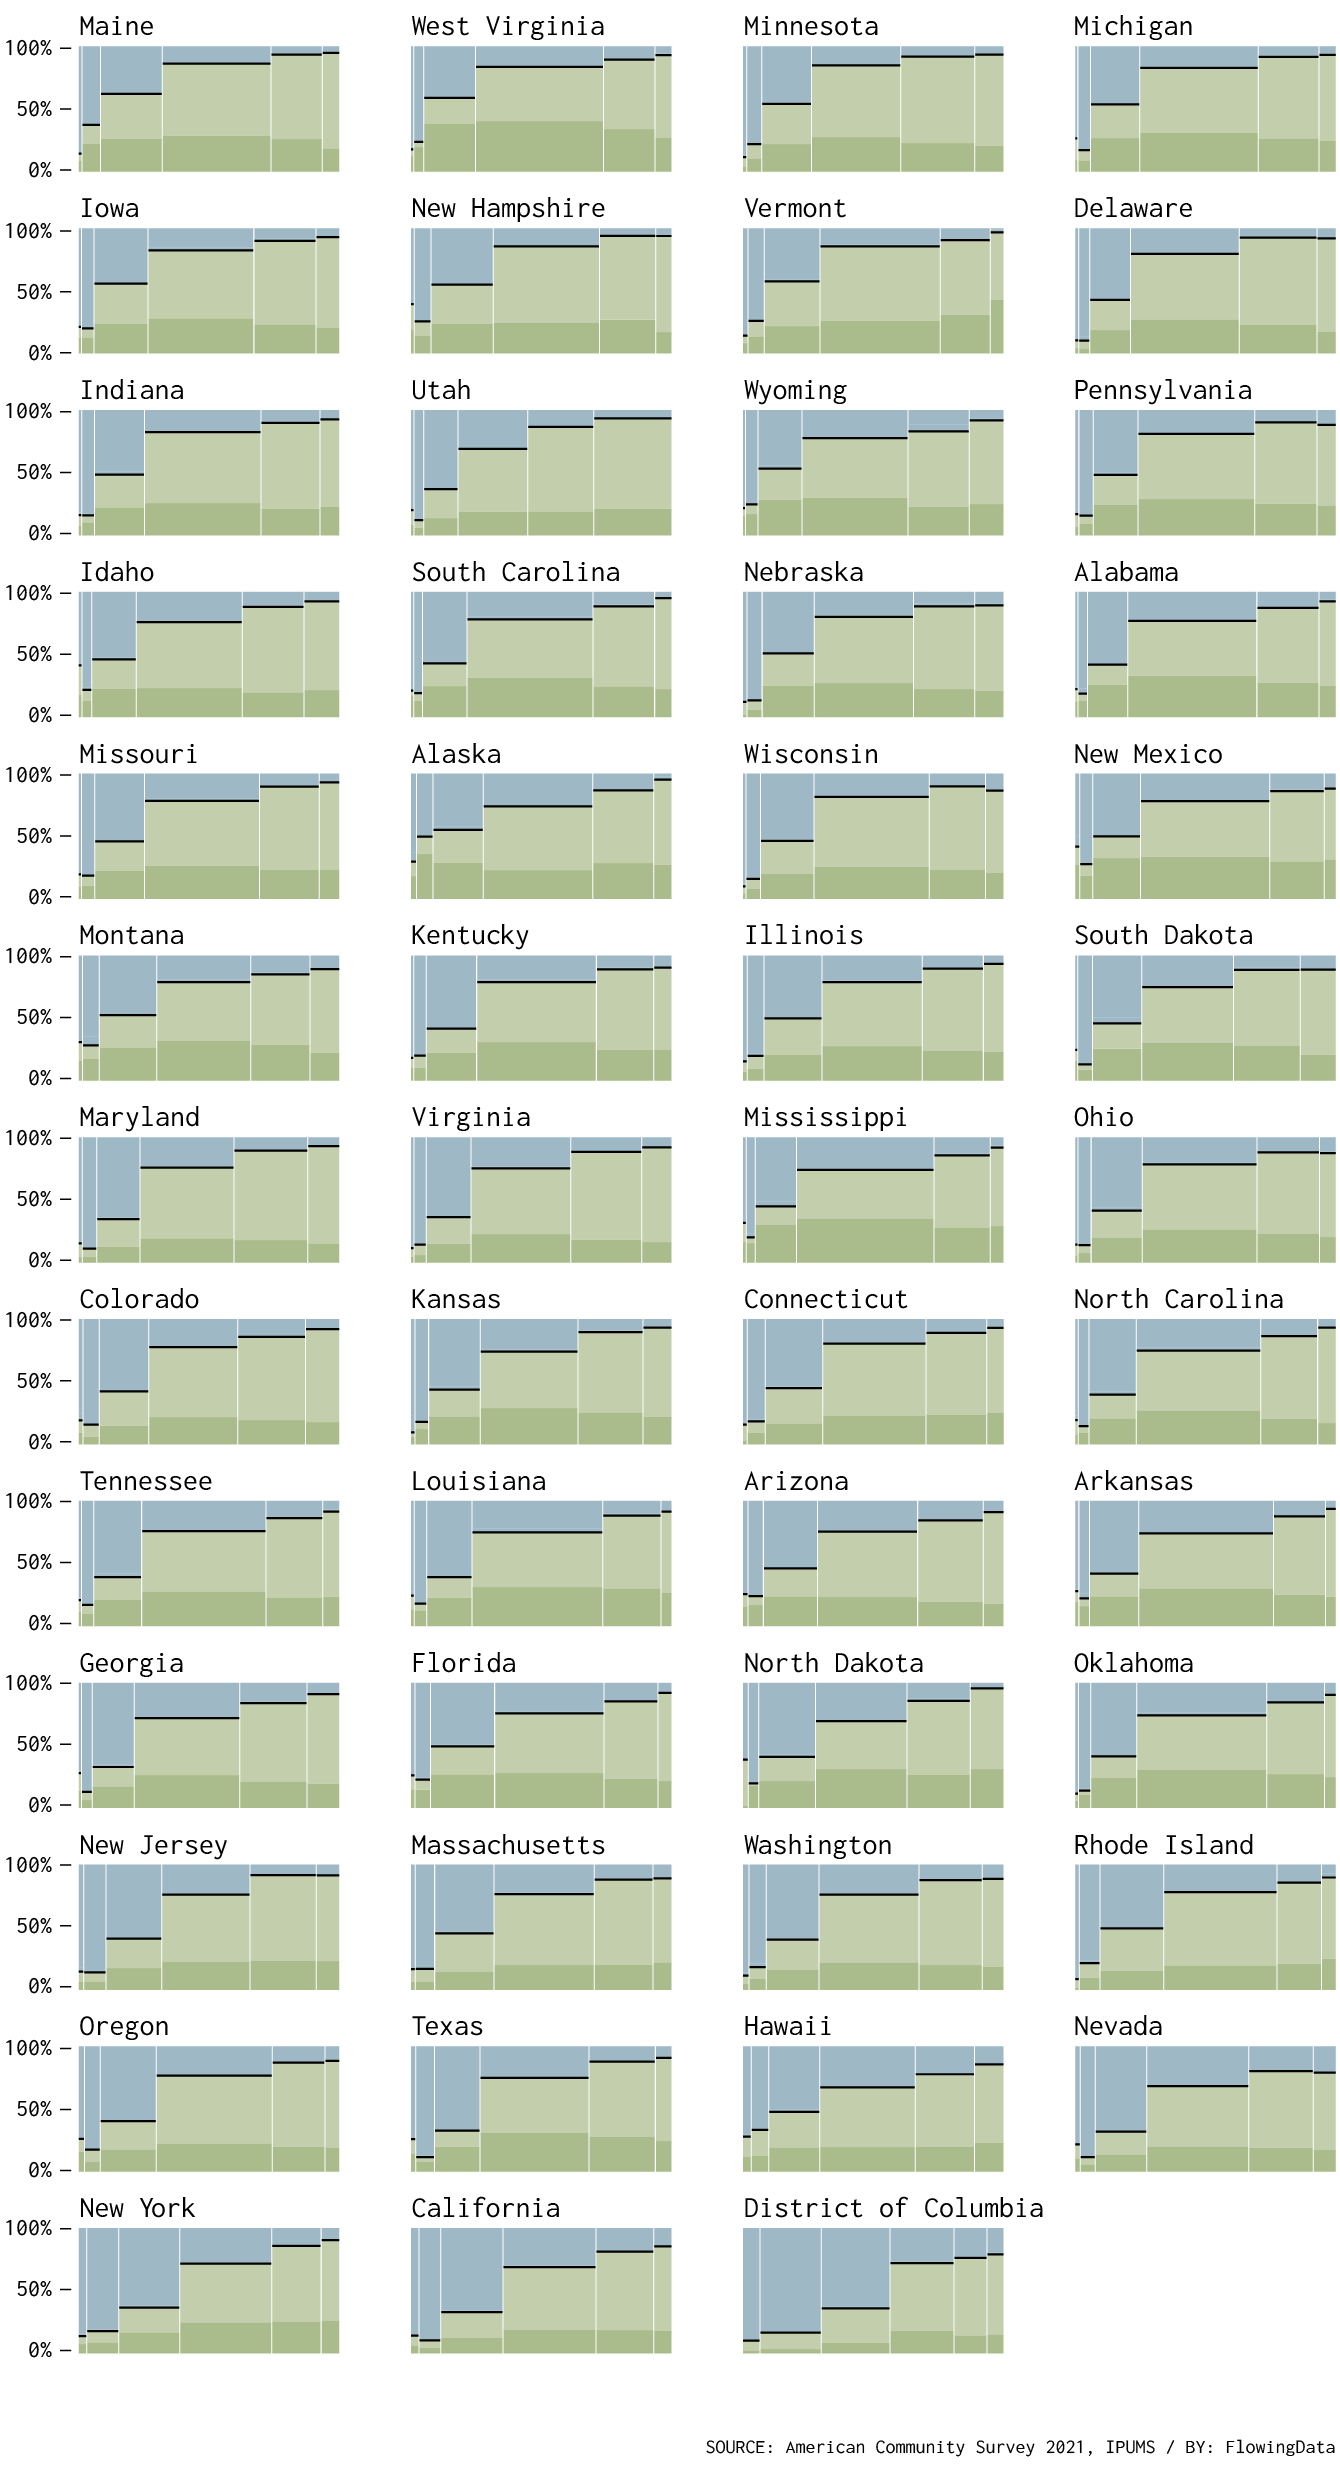
The above varies by state (of course), albeit more subtle.

By Number of Bedrooms, by State

I think there’s something in the predominant four-bedroom in places like Vermont and Oklahoma versus the more evenly distributed room counts in places like Colorado and Washington.

Own and rent by state and bedrooms  

It’ll be interesting to see how these distributions change with more recent data. Sitting here in California, the current mortgage rates are looking painful, which I’m guessing is going to increase the share of renting.

Become a member. Support an independent site. Make great charts.

See What You Get

Learn to Visualize Data See All →

How to Make Interactive Linked Small Multiples

Small multiples are great, and the right interactions can make them even better. A primer and a how-to.

Grabbing Weather Underground Data with BeautifulSoup

Weather Underground is a useful site and a fun place …

How I Made That: Animated Square Pie Chart

Also known as waffle charts. Using animated transitions between values, you can allow for comparisons between categories.

How to Animate Packed Circles in R

Pack circles, figure out the transitions between time segments, and then generate frames to string together.

Favorites

Real Chart Rules to Follow

There are rules—usually for specific chart types meant to be read in a specific way—that you shouldn’t break. When they are, everyone loses. This is that small handful.

Watching the Growth of Walmart

The ever so popular Walmart growth map gets an update, and yes, it still looks like a wildfire. Sam’s Club follows soon after, although not nearly as vigorously.

A Day in the Life: Women and Men

Using the past couple of years of data from the American Time Use Survey, I simulated a working day for men and women to see how schedules differ. Watch it play out in this animation.

Who We Spend Time with as We Get Older

In high school, we spend most of our days with friends and immediate family. But then we get jobs, start a family, retire, and there’s a shift in who we spend our days with.