All the Household Types in the U.S.

When you think of household types in the United States, the most common ones probably come to mind: single, married couple, married couple with a kid, or married couple with two kids. And that makes sense, since that covers about two-thirds of all households.
But I’ve been wondering about the remaining third of households. That’s when you start to see a lot of variation.
10 Most Common Household Types
Based on the American Community Survey from 2021, these are the most common household types.
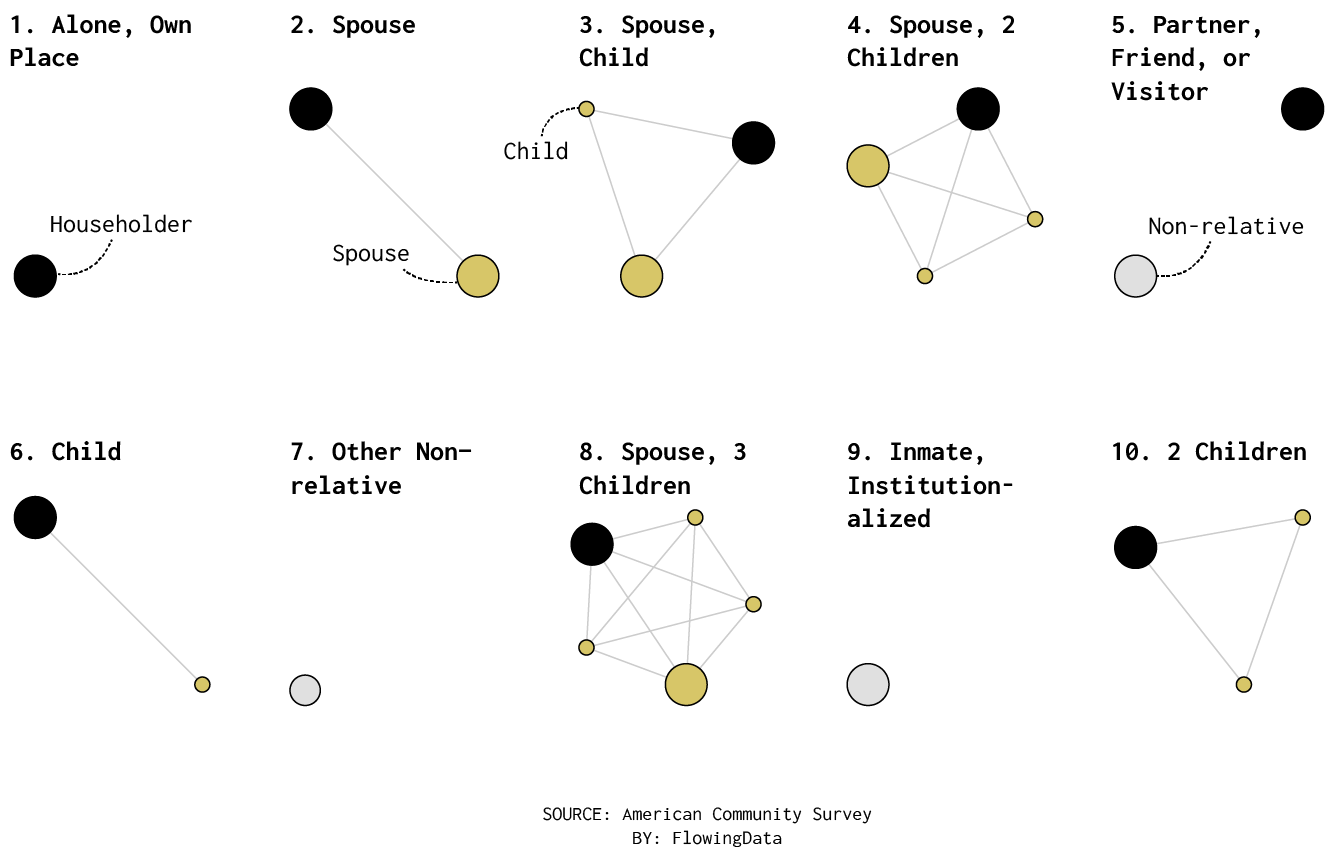
Relationships are relative to the householder who answered the survey. The top comes out as expected, but I was kind of surprised to see inmates and institutionalized people so high on the list. And #7, other non-relatives, is mostly people living in group quarters like dorms.
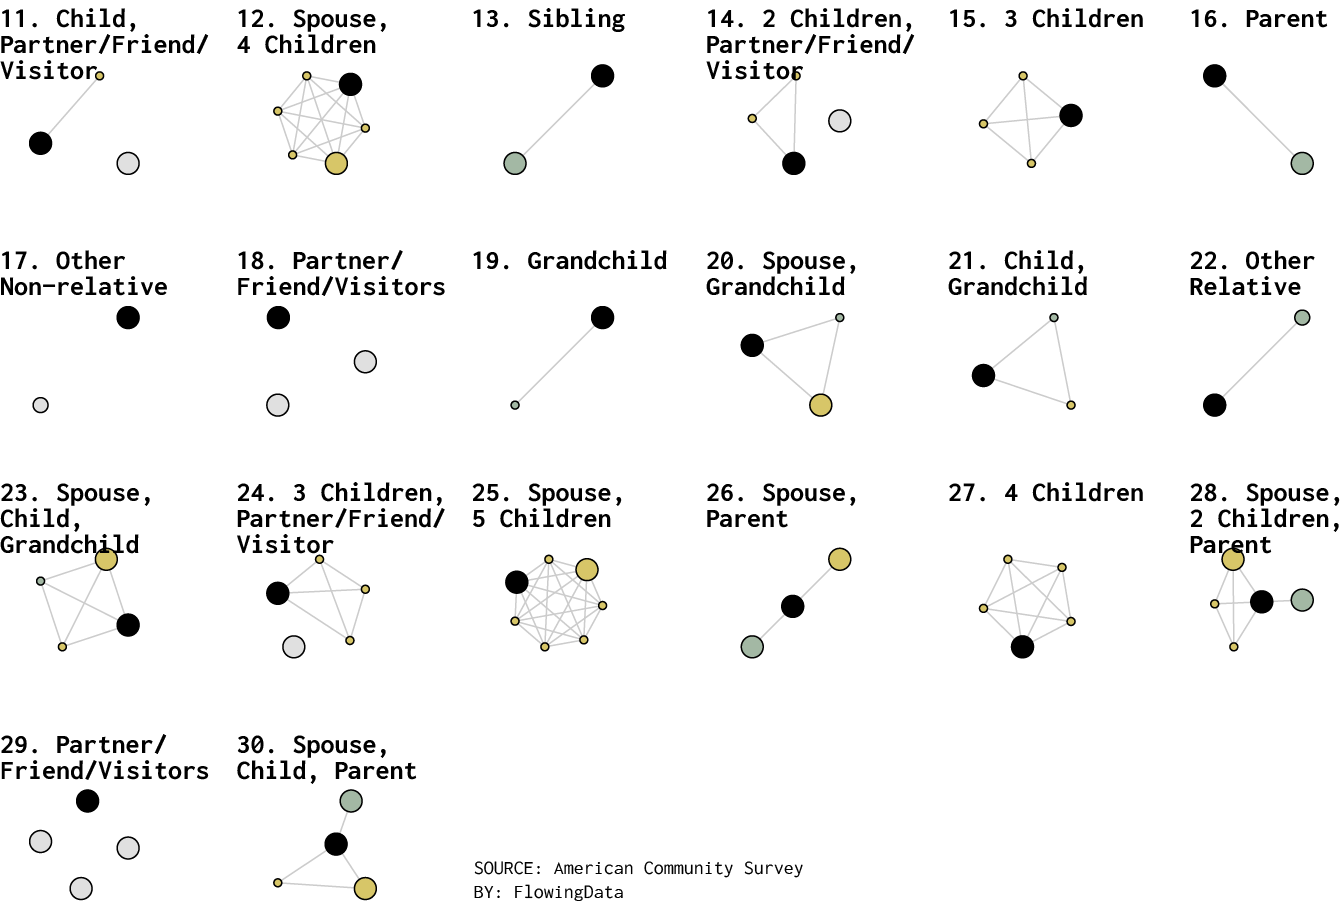
Most Common Household Types, 11 to 30
There are many more household types though. Here’s the eleventh to thirtieth most common. Notice more family members, extended family, kids, and friends.
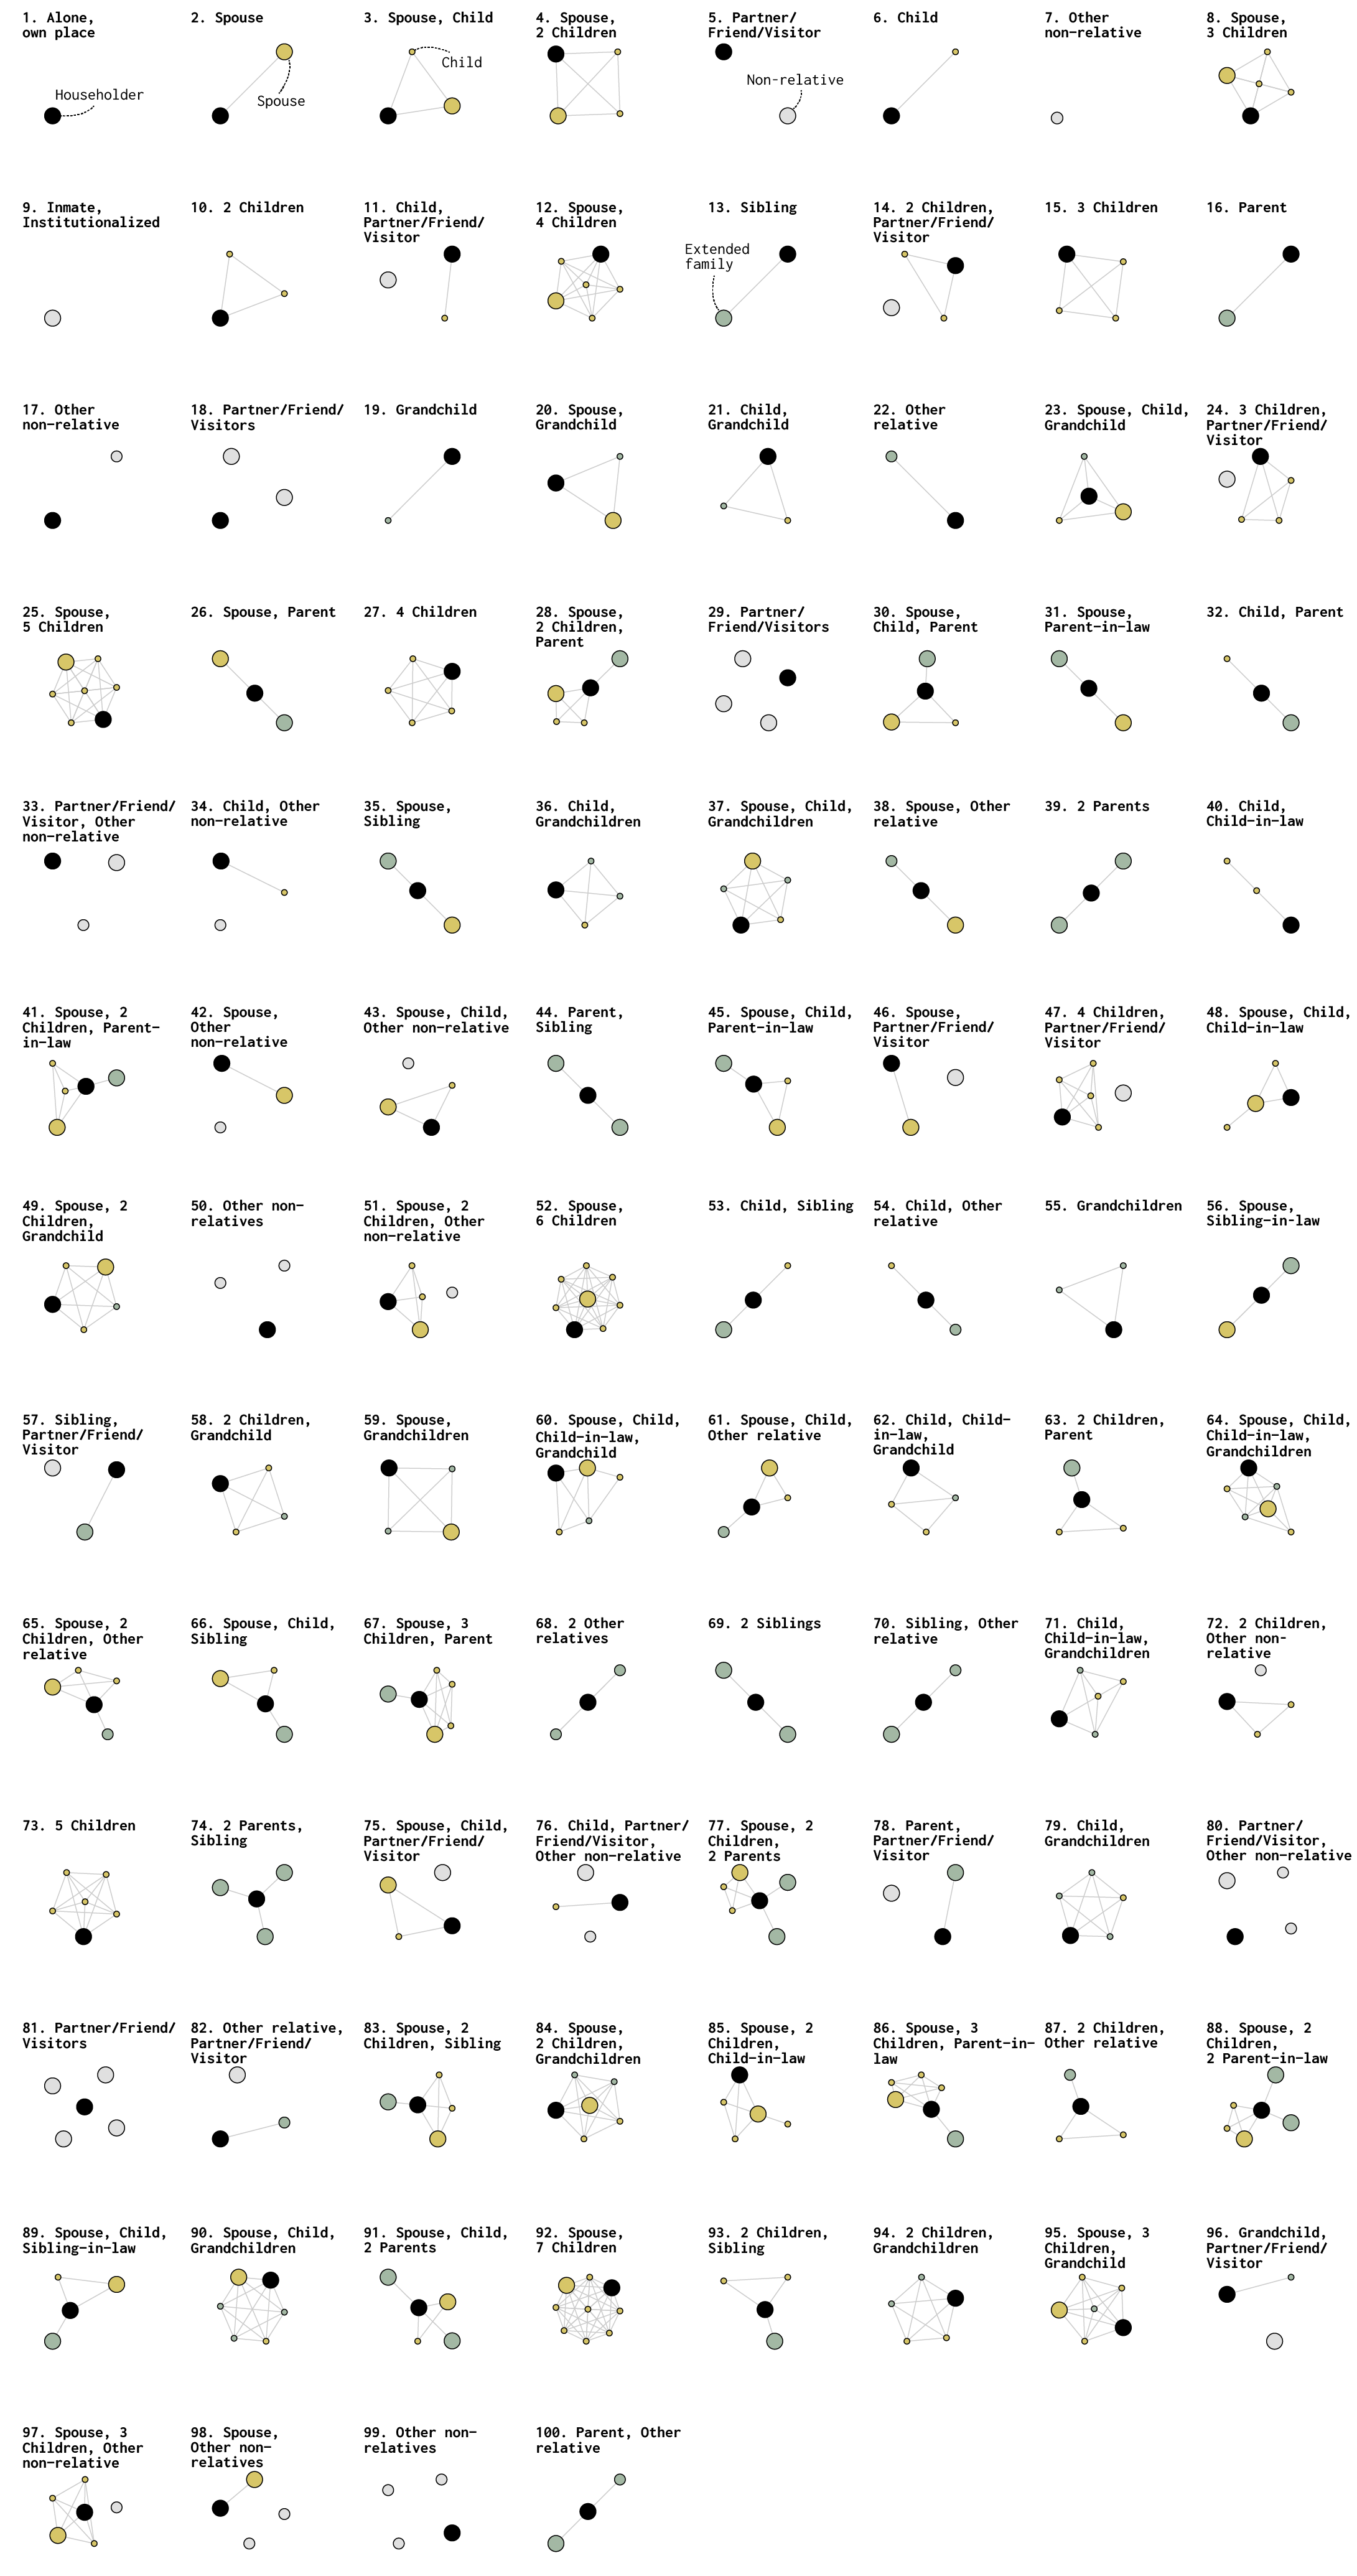
100 Most Common Household Types
Still, this is just a small sample. There were 4,708 types recorded in the ACS data. While we’re looking, here are the top 100.
Largest Household Type
In case you’re wondering, the largest recorded household type had 20 members. There was a married couple, a bunch of kids, extended family, and one non-relative.
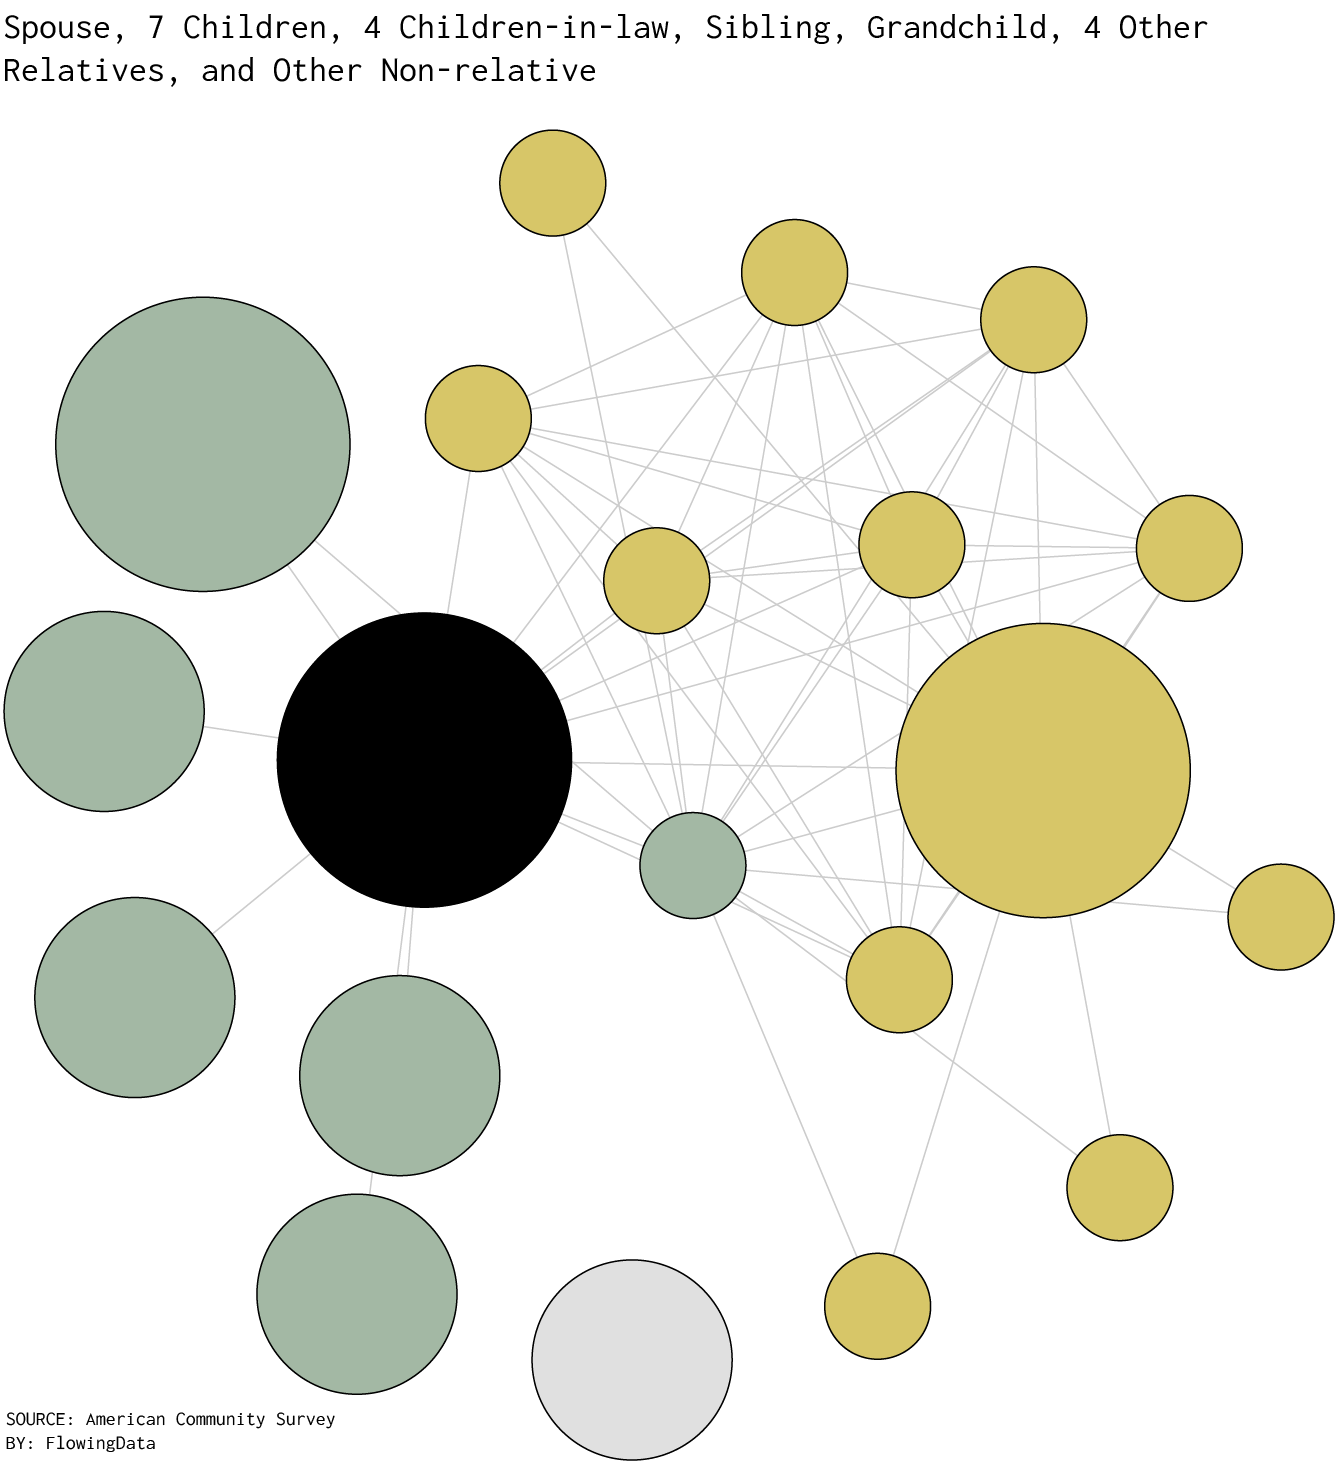
If you’d like to see all 4,708 combinations, you can take a look here (giant PDF).
Notes
The data comes from the 2021 American Community Survey. I downloaded data via IPUMS, processed the data in Python, visualized the data in R, and edited in Adobe Illustrator. The graphics originally labeled all institutionalized people as inmates, however, the category also includes other institutions. If you were to count only inmates, the category would be ranked 11.
Become a member. Support an independent site. Make great charts.
See What You GetFlowingData is made possible by supporting members. Since 2007, I, Nathan Yau, a real person, have been analyzing and visualizing data to help more people understand and appreciate it in their everyday lives.
If you liked this or want to make similar data things, please consider supporting this small corner of the internet. You get unlimited access to visualization courses, tutorials, and extra resources. Thanks. — Nathan
Chart Type Used
