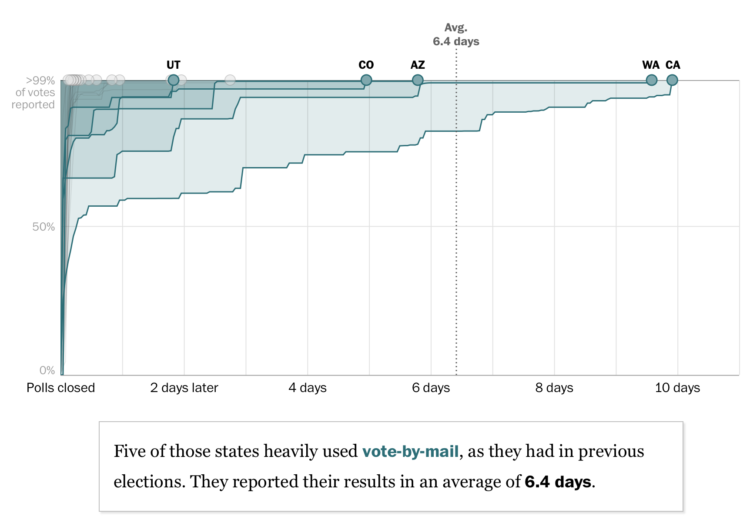
For The Washington Post, Ashlyn Still and Kevin Schaul charted how long it took for primary ballots to be counted in each state. The times might give a hint of what we’re in for on election night:
Before the pandemic struck, mail-in states like California were already counting slowly. Then the coronavirus forced dozens of states to quickly expand absentee voting, and the slowdowns got more dramatic. These two trends — more absentee voting, not much time to prepare for it — could lead to some snail’s-paced race calls in November.
There are some nice details to note in this piece.
The inverted vertical axis and area fills focus on ballots left to count over time instead of ballots already in. The limited contrast keeps attention away from the white space under the lines.
The states move up to the top, and as the lines roll out (in the scrollytelling format), the speed is fixed, so that states that took more time count finish moving later.
And finally, the scrollytelling format helps highlight individual states at a time, and the small multiples at the end probably help satiate those who want to just see it all at once.
It’s a relatively straightforward dataset with multiple time series lines, but the choices make the patterns obvious.


