Parenting and Work Schedule During the Pandemic
Parenting with the stay-at-home, work-from-home, and learn-from-home orders is a tricky thing. There is a fixed number of hours in a day but an unlimited number of things that need to get done.
As it looks like more schools won’t be opening for in-person learning, it seems like it’s about to stay this way for a bit.
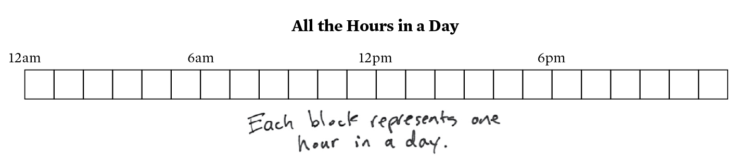
Let’s say this grid of 24 squares is one day:
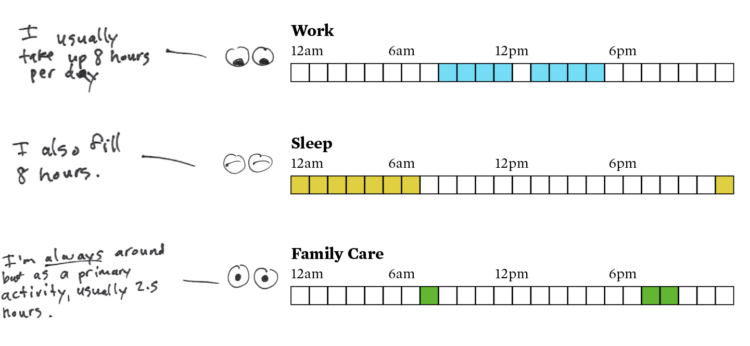
We work. We sleep. Those with kids in the household provide care.
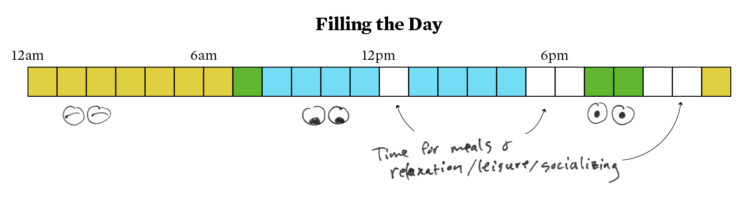
It can seem like a lot at times, but pre-pandemic, it all fit in a regular day.
Things got more challenging when the schools closed…
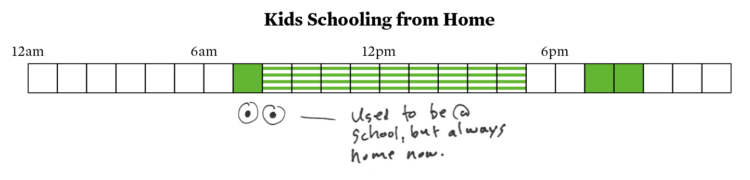
…because work and kids merged into one block.
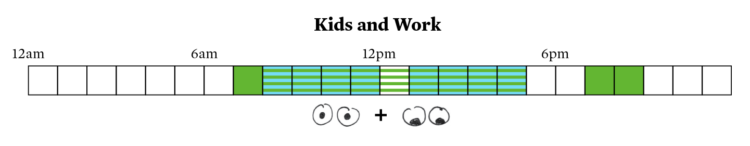
That doesn’t seem so bad in theory, but anecdotally speaking, working with kids (especially those who aren’t very independent yet) is a less productive process.
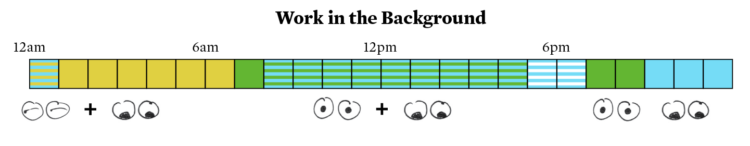
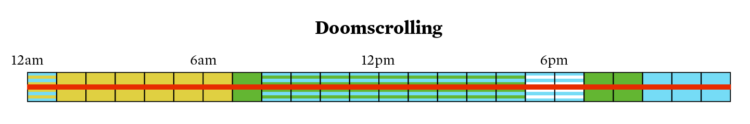
To compensate, something’s gotta give. Sleep? Free time? Work less?
Crazy times. I guess we just make do for now.
…
..
.

…
Become a member. Support an independent site. Get extra visualization goodness.
See What You Get