Redacted

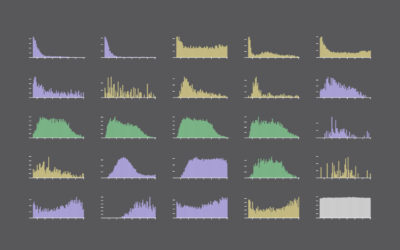
The redacted version (pdf) of the Mueller report was released today. Here’s the thumbnailed view for a sense of the redactions.
I had to do this in R real quick, or I wasn’t going to get anything done for the rest of the day. Here’s my snippet in case you’re interested:
# install.packages(c("pdftools", "png"))

library(pdftools)
library(png)

pdf_convert("mueller-report.pdf")

# Dimensions of 1 page.
imgwidth <- 612
imgheight <- 792

# Grid dimensions.
gridwidth <- 30
gridheight <- 15

# Total plot width and height.
spacing <- 1
totalwidth <- (imgwidth+spacing) * (gridwidth)
totalheight <- (imgheight+spacing) * gridheight

# Plot all the pages and save as PNG.
png("all_pages.png", round((imgwidth+spacing)*gridwidth/7), round((imgheight+spacing)*gridheight/7))
par(mar=c(0,0,0,0))
plot(0, 0, type='n', xlim=c(0, totalwidth), ylim=c(0, totalheight), asp=1, bty="n", axes=FALSE)
for (i in 1:448) {
    fname <- paste("mueller-report_", i, ".png", sep="")
    img <- readPNG(fname)

    x <- (i %% gridwidth) * (imgwidth+spacing)
    y <- totalheight - (floor(i / gridwidth)) * (imgheight+spacing)

    rasterImage(img, xleft=x, ybottom = y-imgheight, xright = x+imgwidth, ytop=y)
}
dev.off()
Chart Type Used

Become a member. Support an independent site. Get extra visualization goodness.
See What You Get