Single-Income Occupations

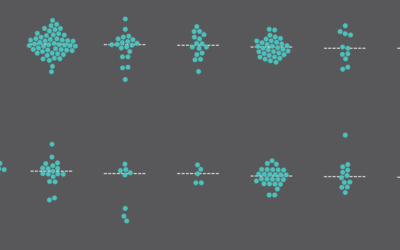
About 18 percent of couple households are single-income. I wanted to know what the earner in these homes usually do.

Become a member. Support an independent site. Make great charts.

See What You Get

Learn to Visualize Data See All →

How to Make an Animated Pyramid Chart in R

Make a bunch of charts, string them together like a flip book, and there’s your animation. Sometimes good for showing changes over time. Always fun to play with.

How to Draw Maps with Hatching Lines in R

Fill areas with varying line density to give more or less visual attention. With geographic maps, the technique is especially useful to adjust for population density.

Build Interactive Area Charts with Filters

When you have several time series over many categories, it can be useful to show them separately rather than put it all in one graph. This is one way to do it interactively with categorical filters.

How to Make Animated (GIF) Heatmaps in R

Using color as the visual encoding, show changes over time in two dimensions.

Favorites

Finding the New Age, for Your Age

You’ve probably heard the lines about how “40 is the new 30” or “30 is the new 20.” What is this based on? I tried to solve the problem using life expectancy data. Your age is the new age.

Shifting Incomes for American Jobs

For various occupations, the difference between the person who makes the most and the one who makes the least can be significant.

The Best Data Visualization Projects of 2014

It’s always tough to pick my favorite visualization projects. Nevertheless, I gave it a go.

The Stages of Relationships, Distributed

Everyone’s relationship timeline is a little different. This animation plays out real-life paths to marriage.