Switching Jobs

Many dream of the day they can walk into their boss’s office to tell him or her what they really think and then storm out in a blaze of glory. Or, maybe there’s less bitterness involved, and you just feel like it’s time to shift the career path.
Where do you go after you leave your current job? Do you stay with what you know, or do you pursue something totally different? What are the possibilities?
This was George Constanza’s dilemma. The lazy character in Seinfeld, a real estate agent forever trying to get out of doing actual work, quits his job without thinking things through.
In the charts below, I look at what people did in real life. The data comes from the Current Population Survey, between 2011 and 2016. The Census Bureau and Bureau of Labor Statistics run the survey on an ongoing basis.
The survey covers a lot of topics, but we’re most interested in people’s current occupation at the time of the survey and what they were doing the previous year. Then focus on the people whose occupation the previous year is different from the current year.
With this subset of the data, we get a sense of where people go, given their previous job.
But first, let’s look at the percentage of people who switched jobs during the sample period. I’m gonna call it the switching rate. I only show occupations with at least 100 survey participants.
This makes sense. At the top with the highest switching rate, you have lifeguards, which I’m pretty sure trends younger and more temporary. Jobs that trend towards higher salary and more training, education, and experience have lower switching rates. Real estate agents are around the middle at about 16 percent.
So when people do switch jobs, it seems only natural that they’d look to something related. After all, skills or experience in one area can carry over to another. For example, George could use his (supposed) sales skills in a different sales area.
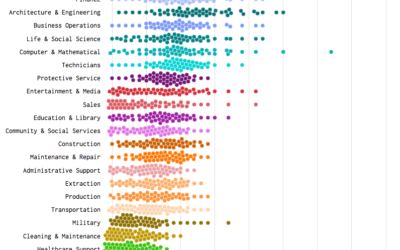
The chart below shows the percentage of people who stayed in the same job category and those who switched to something else, among those who switched occupations.
Healthcare practitioners, such as physicians and nurses, are at the top at just under 80%. Again, this seems to make sense, at least from an anecdotal point of view. Job categories with lower time to entry appear lower. I was surprised to see the legal category down so far, but this category includes paralegals, legal assistants, and other support workers.
Sales workers are just about 50-50.
This leads to our main question: Given you have a certain job, what are the possibilities? The following chart shows the breakdown for the top 20 jobs people switched to given their original job. Search to see where people with your job went.
And there you have it.
The better answer of course is that it’s never too late to switch to what truly drives you. George eventually ended up working for the New York Yankees — in sports, just like he wanted.
 Constructed Career Paths from Job Switching Data
And then I daisy chained job switches to construct career paths from any given job to every other job.
Notes
- The data comes from the Current Population Survey, 2011 through 2016. I downloaded the microdata using the IPUMS CPS extraction tool.
- Some occupations had small sample sizes, so not that many possibilities show up for them in the search interactive.
- I used R for analysis and data preparation. I used d3.js for visualization.
Become a member. Support an independent site. Get extra visualization goodness.
See What You Get


