Chances it’s a Friend’s Birthday Every Single Day of the Year

It seems like every day I log in to Facebook, it’s someone’s birthday, and I’m not even a very active user. I think it’s been at least a year since I last friended someone. Maybe two. Also, I have fewer than 365 friends on the social network, so it’s mathematically impossible for there to be a birthday every single day of the year.
But still, it seems like a lot of days with at least one birthday.
Two questions:
- How many friends do you need to nearly guarantee that during any given day of the year, it’s at least one friend’s birthday?
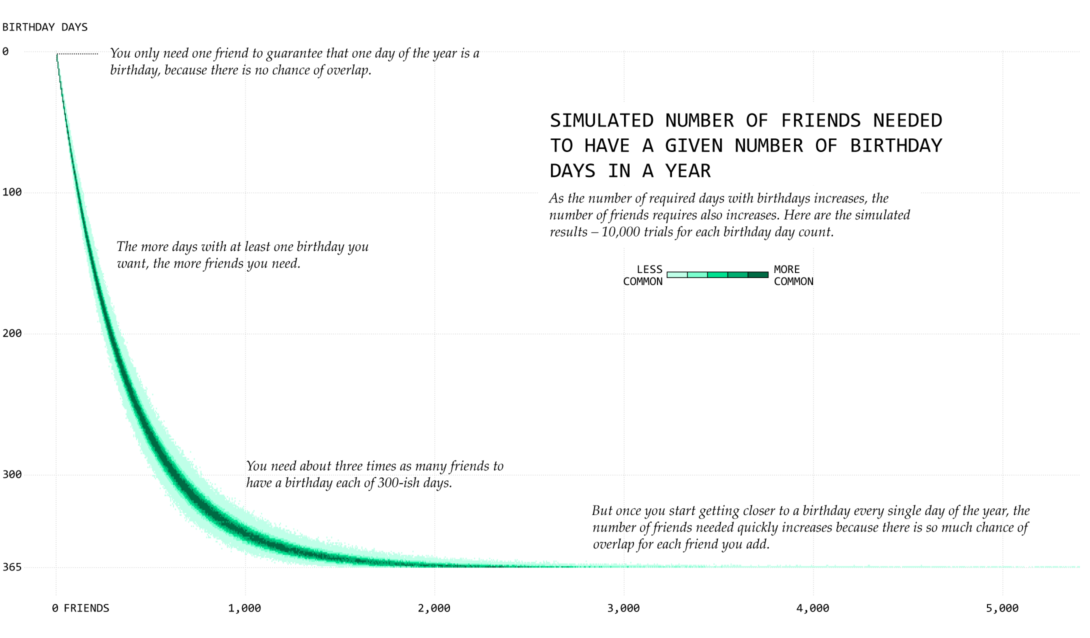
- How many friends do you need for just a given proportion of days of the year with a birthday?
I was sure someone had answered these question before, so I googled it first. I came across a couple of answers on Wikipedia, which assumes that birthdays are completely random and the solutions don’t account for leap birthdays.
More generally, in probability theory, this is known as the coupon collector’s problem. Say you want to collect 10 coupons, each for a unique item. Drawing coupons randomly, how many draws do you need to get all 10 coupons?
Here’s what the probabilities look like, as it pertains to our birthday problem.
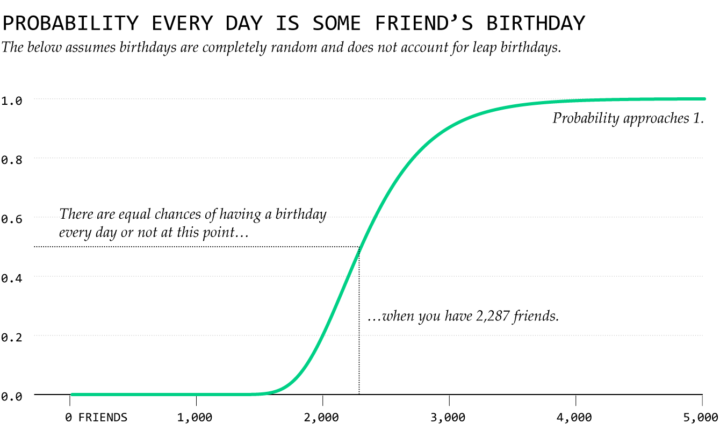
So assuming birthdays are random and disregarding leap birthdays, you have about a 50-50 chance that any given day of the year is some friend’s birthday with 2,287 friends or more. Once you have about 4,000 friends, you get close to certain that it’s some friend’s birthday.
Of course, as with most useless curiosities related to data, I couldn’t just stop there with those assumptions floating there taunting my very existence. For example, more people are born in September than in January. Leap birthdays are much more rare, because they’re only possible every four years.
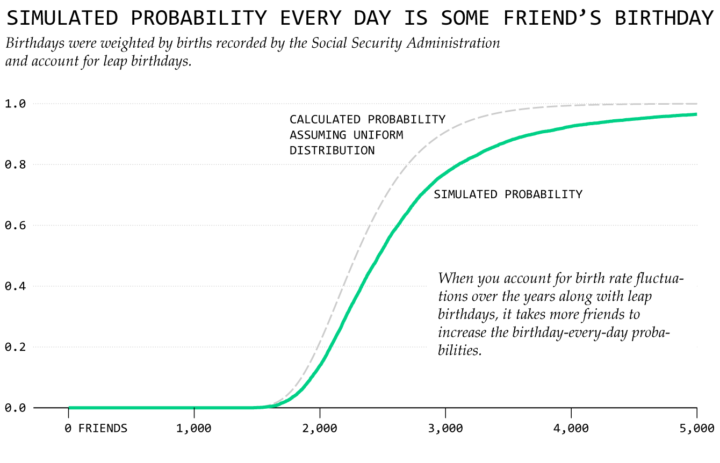
Using birth data from the Social Security Administration, made readily available by FiveThirtyEight, I sampled based on real life birthday frequency. The 50-50 mark for the simulations I ran higher landed at 2,468 friends.
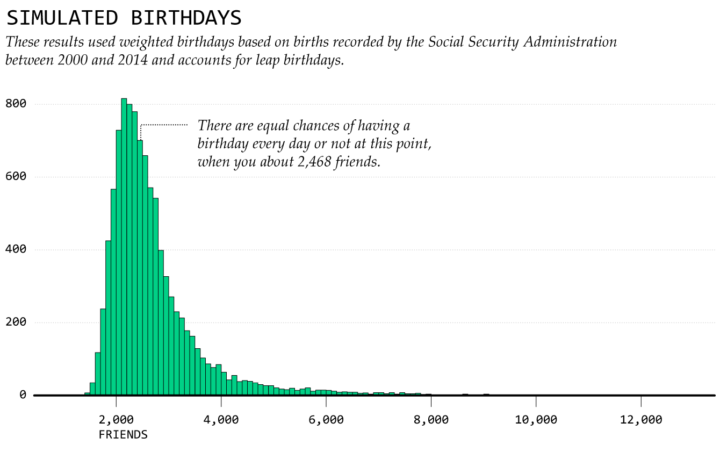
This pushes the simulated probability curve down and to the right compared to the curve that assumes a uniform distribution. So in reality, it takes more friends to get a birthday every day.
That answers the first question.
Now for the second. How many friends do you need to, say, have 100 days out of the year be at least one person’s birthday? I ran the simulations. This is what you get.
Become a member. Support an independent site. Get extra visualization goodness.
See What You Get