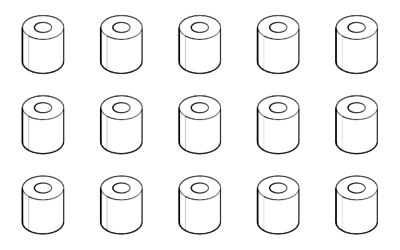
Bed Sizes Around the World

When you book a hotel in the United States, you know what size bed you’re going to get, based on the description. But when you travel to other countries, the bed size in the place you visit is often different from what you’re used to, despite having a description as such.

In some places, a king bed is actually smaller than a queen bed here, or a twin/single bed might seem more like a double.

Wikipedia has a non-comprehensive list of bed sizes in different parts of the world. Here’s a visual look at the variations.

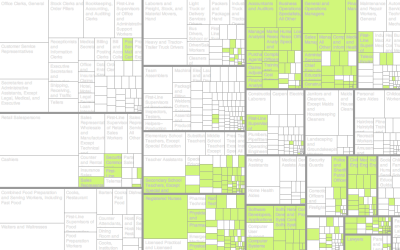
Drawing Squares and Rectangles in R

Roll your own rectangular-shaped charts.

Become a member. Support an independent site. Make great charts.

See What You Get

Learn to Visualize Data See All →

How to Make Interactive Frequency Trails with D3.js

Layering time series data or distributions with this method can change the feel and aesthetic versus a multi-line chart or small multiples. In some cases, frequency trails let you show more in less space.

How to Make Horizon Graphs in R

The relatively new and lesser known time series visualization can be useful if you know what you’re looking at, and they take up a lot less space.

How to Animate Packed Circles in R

Pack circles, figure out the transitions between time segments, and then generate frames to string together.

How to Make Marimekko Charts in Excel

Marimekko charts, or mosaic plots, allow you to compare categories over two quantitative variables.

Favorites

Divorce and Occupation

Some jobs tend towards higher divorce rates. Some towards lower. Salary also probably plays a role.

10 Best Data Visualization Projects of 2015

These are my picks for the best of 2015. As usual, they could easily appear in a different order on a different day, and there are projects not on the list that were also excellent.

Best Data Visualization Projects of 2016

Here are my favorites for the year.

How the American Work Day Changed in 15 Years

The American Time Use Survey recently released results for 2018. That makes 15 years of data. What’s different? What’s the same?