How You Will Die

So far we’ve seen when you will die and how other people tend to die. Now let’s put the two together to see how and when you will die, given your sex, race, and age.
I returned to the Underlying Cause of Death database maintained by the Centers for Disease Control and Prevention. It provides data for the number of people who died in the United States between 1999 and 2014. The records are based on death certificates, which require an entry for a single cause of death.
The CDC classifies the causes into 113 subcategories, which fit under the umbrella of 20 categories of disease and external causes. More specifically, the CDC uses the International Statistical Classification of Diseases and Related Health Problems (ICD), which is published by the World Health Organization.
The simulation below covers the main categories, or chapters, as they’re referred to by the ICD.
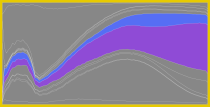
Enter your sex, race, and age. Each dot represents one of your simulated lives, and as each year passes, more of your simulated selves pass away. Color corresponds to cause of death, and the bars on the right keep track of the cumulative percentages. By the end, you’re left with the chances that you will die of each cause.
Try shifting age down to zero and watch the rate of change. One thing that you should notice is that once you get past year one, it’s low likelihood that you die in the next few decades. It’s not until later years when the dots start to change color much quicker. You couldn’t see this in the normalized chart.
The main point, which is what you’d expect, is that mortality rate is much lower in the earlier years of life than in the older years. But, if you do die at a younger age, it’s much more likely due to something external rather than a disease.
You can also look at it the other way. Shift age to the older years, and let the simulations run. You’re much more likely to die of a disease rather than something external. Shift past 80 years, and it’s over 40 percent chance the cause will be circulatory, regardless of demographic group.
This surprised me, because it seems like cancer would be the leading cause just going off general news. This is certainly true up to a certain age, but get past that and your heart can only keep going for so long.
 How Other People Die
Want to know how other people die? Here’s causes of death all at once.
Nerd Notes
- The CDC database only provides population estimates for 84 years and younger. For 85-plus, you can only get number of deaths by cause, which means I could not calculate a crude mortality rate for these years. Instead, I used probability of death from the Social Security Administration for the later years. Not ideal, but since we’re focused on cause of death rather than timing, it was good enough for me.
- Along the same lines, the CDC mortality numbers stop at 100 years old or greater.
- The ICD chapters encapsulate many causes of death. It’s worth looking at the database if you’re interested in a specific cause.
- I did analysis and data preparation in R and I made the interactive with d3.js.
Become a member. Support an independent site. Make great charts.
See What You GetFlowingData is made possible by supporting members. Since 2007, I, Nathan Yau, a real person, have been analyzing and visualizing data to help more people understand and appreciate it in their everyday lives.
If you liked this or want to make similar data things, please consider supporting this small corner of the internet. You get unlimited access to visualization courses, tutorials, and extra resources. Thanks. — Nathan
Chart Types Used

