Sports loves conditional distributions. What does Joe Billy Bob typically do against such and such team? How does play differ in wins and losses? And a lot of the data is easily accessible, which makes it straightforward to answer these questions. Buckets, by Peter Beshai, uses NBA data to explore shot selection with plenty of conditionals.
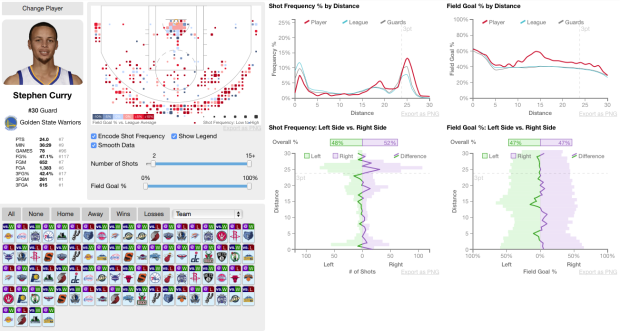
The above is a partial view of Stephen Curry’s shot selection. If you follow professional basketball, the shot chart shouldn’t be too surprising, with lots of threes at a higher percentage than the league average.
You also get shot distributions for distance and position on the court. More conditionals, you say? You can select the specific games you’re interested in (from the 2013-14 season), or choose the more common categories such as games the team won or lost.
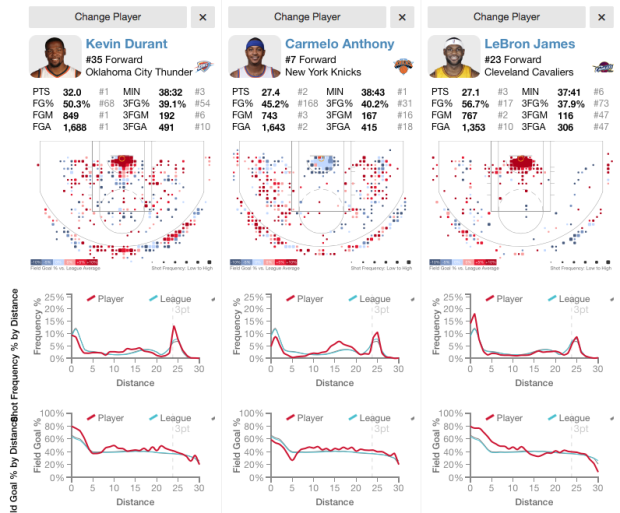
Maybe you want to compare players. Buckets has you covered.
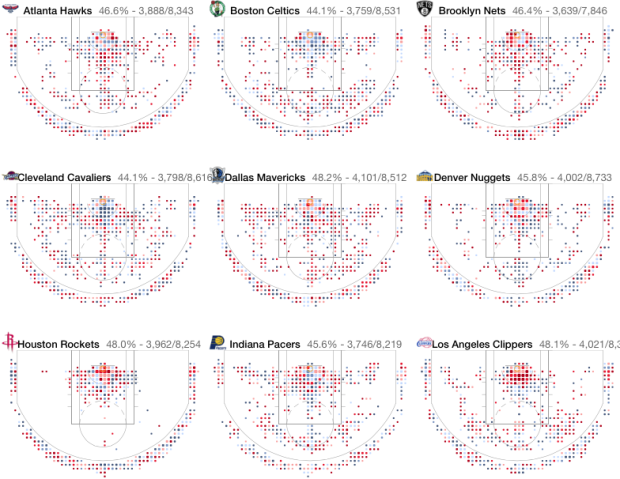
There’s also a league-wide view and team multiples.
Basically, if you’re into basketball, you’ll be able to spend some time with this project. There’s a lot to poke at.
 Visualize This: The FlowingData Guide to Design, Visualization, and Statistics (2nd Edition)