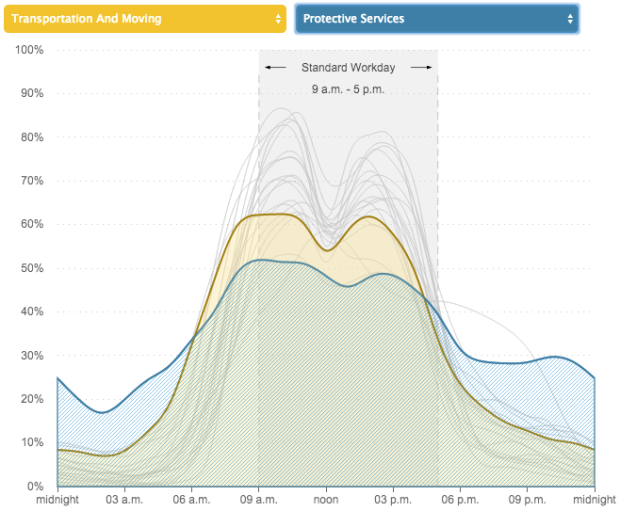
In another use of data from the American Time Use Survey, Planet Money looks specifically at the hours people work, separated by twenty job categories. Each density area represents a category, and height represents the percentage of people (estimated with survey answers) who are at work at various hours of the day.
The interesting bit is that you can select two job categories to easily compare at once. For example, the above shows transportation in yellow against protective services in blue. For the latter, you see a more spread out distribution, as it’s more common for those in protective services to work at night.
The stacked area chart from the New York Times from almost six years ago (whoa, time) is still my favorite visualization of the survey data.
 Visualize This: The FlowingData Guide to Design, Visualization, and Statistics (2nd Edition)