One Dataset, Visualized 25 Ways
“Let the data speak.” It’s a common saying for chart design. The premise — strip out the bits that don’t help patterns in your data emerge — is fine, but people often misinterpret the mantra to mean that they should make a stripped down chart and let the data take it from there.
You have to guide the conversation though. You must help the data focus and get to the point. Otherwise, it just ends up rambling about what it had for breakfast this morning and how the coffee wasn’t hot enough.
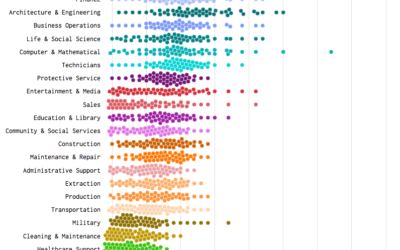
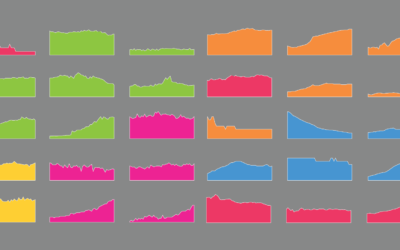
To show you what I mean, I present you with twenty-five charts below, all based on the same dataset. It’s life expectancy data by country, it’s from the the World Health Organization and it spans 2000 to 2015. Each chart provides a different focus and interpretation.
Click images for the full size charts.


These are more sketches than they are finished graphics. There’s not much annotation, highlights, or explanations, and there isn’t any interaction. The geometry and visual encodings are straightforward. But you get the picture, right?
Data often has a lot — sometimes too much — to say.
Getting to the Point
What do you do when you have a lot of data? What if you don’t have a lot of time to poke at a dataset? How should you visualize your data? Here’s what you can do.
- Ask the data questions.
- Start with the visualization basics.
- Focus.
I’ll explain.
Ask Questions
If you just let the data ramble, you have to pick out the interesting bits and filter out the unimportant ones. Sometimes this route is useful, especially when you don’t know what you’re dealing with. It’s kind of like listening in on a conversation or a roundtable.
Or, you can take the quicker route and ask questions to guide the conversation. This is more like an interview where you have specific ideas or concepts to look for. There are generic questions such as:
“What is the structure of the data?” and “What is the mean and median?” It’s easy to find the answers to these.
Then there are more complex questions that require more legwork such as:
“What’s going on with that outlier? Is it a data entry error, or is there something interesting going on there?” Maybe you’re interested in correlations, relationships, distributions, or the fabled cause-and-effect.
This leads you to context-specific questions, which is often the most interesting part of a dataset (and the answer might be outside of the dataset in question). For example, with this life expectancy dataset, the history of the countries with dramatic fluctuations might be the place to look more closely.
Start with the Basics
Looking at more advanced visualization, you might find yourself wanting to do the same or some variation. That’s good. But if you’re brand new to the practice, programming, or the software, it might feel like a long path to get to where you want to go. That’s fine too.
Work incrementally. Start with the most basic of bar charts and work your way to more advanced projects.
Similarly, start with introductory statistics and work your way towards more complex analyses. The early stuff serves as a foundation for the bigger things to come.
This will also help you with that first part on asking questions. The more statistics you know, the more worthwhile questions that pop into your head. It provides a vehicle for thinking about data.
Focus
As you learn more, you get more choices, which in itself can be a challenge. Resist the temptation to add so many things to your visualization that it obscures the original purpose.
That said, don’t use this as an excuse to resist trying new things. You won’t know how far you should go until you’ve gone too far.
Iterate.
Practice.
Then let the data speak.
Become a member. Support an independent site. Get extra visualization goodness.
See What You Get