Americans are Growing Bigger

We continue to eat more and move less, which is problematic from a health perspective. It’s why about one in three adults who saw a physician in 2010 were advised to exercise. In 2014, more than twice as many people were diagnosed with diabetes than in 1980.
Obesity also continues to rise. The Centers for Disease Control and Prevention estimates that about 29 percent of adults were obese in 2014 and 35 percent were considered overweight. This is based on Body Mass Index, or BMI, which takes weight and height into account. This is the formula:

Below 18.5 is underweight, greater than 18.5 and less than 25 is normal or healthy weight, 25 to under 30 is overweight, and 30 or above is obese. Whether or not these breakpoints are still good for classification is open for discussion, but studies show that BMI is a strong indicator for body fatness (excluding athletes).
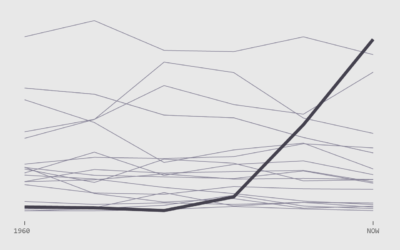
With this in mind, we can look at how BMI among adults changed over the years, in particular the 30-year period between 1984 and 2014. A higher and higher percentage of adults inch above the obesity line.
The shifting distribution of BMI is based on data from the CDC’s Behavioral Risk Factor Surveillance System. The survey of hundreds of thousands per year dates back to 1984, which allows us to see developments over time.
For BMI, there is some noise and spikes, which I suspect is partially from survey participants rounding their height and weight, but the percentages clearly shift up towards higher BMIs.
Compare males and females, and you can see that in the 1980s, the percentages for females favored the lower portion of the chart, whereas males favored the upper portion of the chart. In 1984, 50 percent of adult males were already overweight or obese. Only about a third of females fell in the same BMI range. However, in 2014, the percentages evened out more with 72 percent of males and 62 percent of females falling into the overweight or obese category.
Basically, “normal weight” is now abnormal and “overweight” and “obese” is commonplace.
Be right back. I need to move more.
 The Changing American Diet
See what we ate on an average day, for the past several decades..
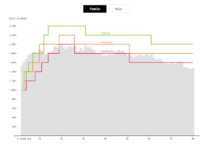 How Much We Eat vs. How Much We Need
Just a hunch, but we might be eating too much.
Nerd Notes
- The BRFSS provides data from surveys conducted over the phone, so you it’s likely you don’t get super-precise height and weight measurements from every individual. But still, the overall trend is clear.
- Along the same lines of survey accuracy, earlier surveys were conducted in fewer states and with fewer participants, so you can take that for what it is.
- I analyzed and processed the data in R and made the visualization with d3.js.
Chart Type Used

Become a member. Support an independent site. Make great charts.
See What You Get