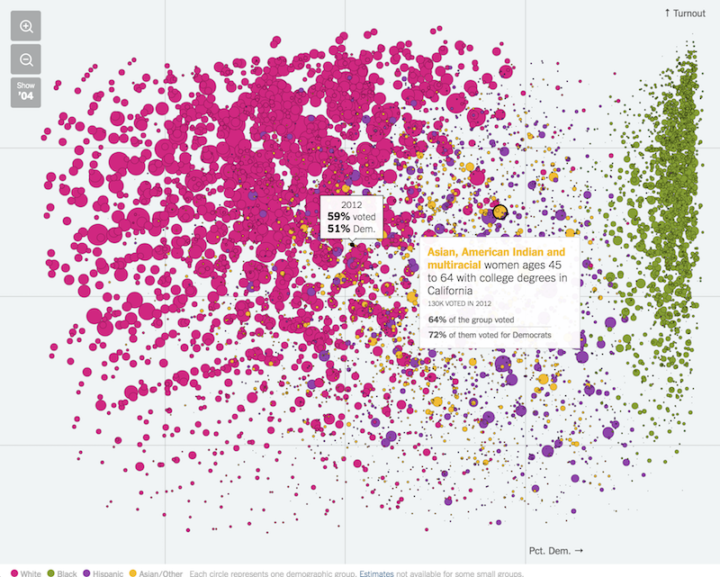
Voter turnout and political leanings for various demographic groups play an important role on the campaign trail. Candidates can’t go everywhere and talk to every single person, so they pick and choose. From the voter perspective, turnout feeds into an indicator for influence. In this interactive by Nate Cohn and Amanda Cox for the Upshot, Democrat percentage is plotted against turnout.
Each bubble represents a demographic — such as Asian women between 45 and 64 years old with college degrees living in California — and size represents number of votes in 2012 or 2004. See the big picture at first, and then use the dropdown menus to filter down to your group of interest.
 Visualize This: The FlowingData Guide to Design, Visualization, and Statistics (2nd Edition)