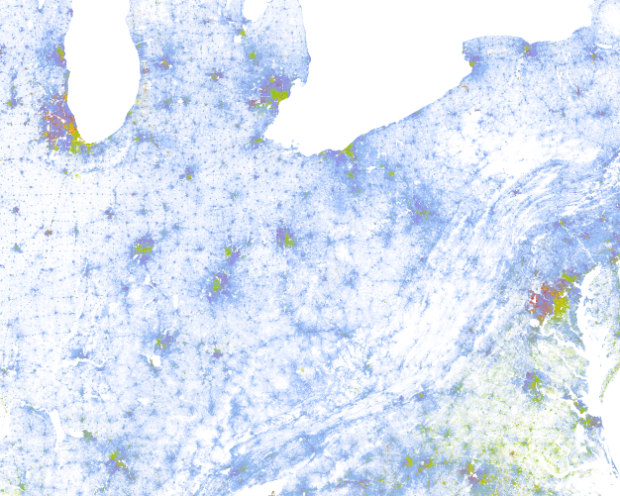
Dustin Cable, a demographer at the University of Virginia’s Weldon Cooper Center for Public Service, added another dimension to Brandon Martin-Anderson population map. The racial dot map by Cable draws a dot for each person in the United States based on the 2010 census and colors by ethnicity.
This map is an American snapshot; it provides an accessible visualization of geographic distribution, population density, and racial diversity of the American people in every neighborhood in the entire country. The map displays 308,745,538 dots, one for each person residing in the United States at the location they were counted during the 2010 Census. Each dot is color-coded by the individual’s race and ethnicity. The map is presented in both black and white and full color versions. In the color version, each dot is color-coded by race.
It’s like a dottier version of the maps by The New York Times back in 2010. Or the originals by Bill Rankin who drew a dot for every 25 people.
Keep in mind this is all based on freely available data from the National Historical Geographic Information System. They have data that goes back to 1790.

 Visualize This: The FlowingData Guide to Design, Visualization, and Statistics (2nd Edition)