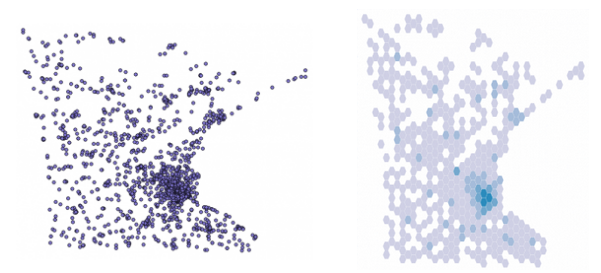
As an alternative to dot density maps, Binify by Kevin Schaul allows you to map with hexagon binning in Python.
Dot density maps are a straightforward way to visualize location data, but when you have too many locations, points can overlap and obscur clusters and trends. That’s where binning comes in. Generally speaking, the goal is to look at an area on a map and then count how many points are within that area. Do that across the entire area.
Grab the package on GitHub and go to town.


 Visualize This: The FlowingData Guide to Design, Visualization, and Statistics (2nd Edition)

Matplotlib also includes this feature: http://matplotlib.org/examples/pylab_examples/hexbin_demo.html