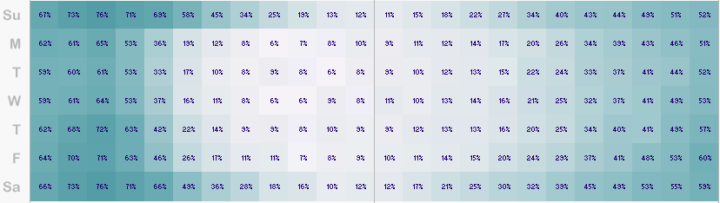
I made a graphic a while back that showed traffic fatalities over a year. John Nelson extended on that, pulling five years of data and subsetting by some factors: alcohol, weather, and if a pedestrian was involved. And he aggregated by time of day and day of week instead of calendar dates.
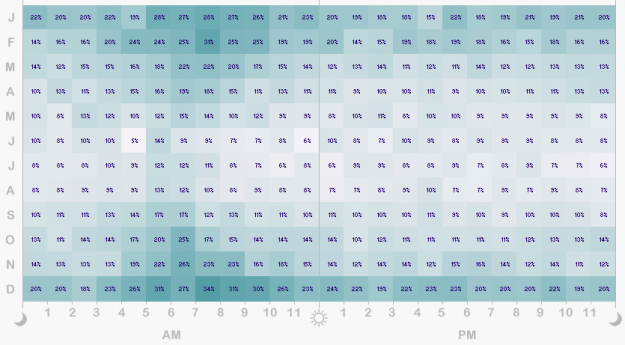
For example, the above is the breakdown of accidents that involved alcohol. As you might expect, there’s a higher count of traffic fatalities during the weekend and late night hours since people don’t have to work the next day. Or you can see when weather is a factor:
See more breakdowns here.

 Visualize This: The FlowingData Guide to Design, Visualization, and Statistics (2nd Edition)