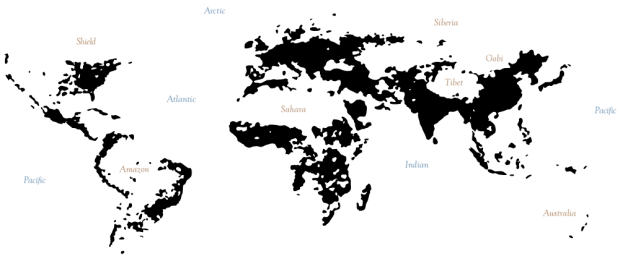
Geography graduate student Derek Watkins has some fun with population densities in an interactive version of William Bunge’s The Continents and Islands of Mankind. The above shows areas in the world where there are at least 15 people per square kilometer. In the interactive, a slider lets you shift that number up to 500 where only a few spots in the world remain.
An interesting thing about this map is that each layer is contained in one 23,000 pixel tall spritesheet to reduce load time. An uninteresting thing is that my workflow was to export black and white density images from QGIS (which I’ve been working with more lately), generalize in Illustrator, export each slice and then stitch them together into one image with ImageMagick. I grabbed the population data from here.
[via Derek Watkins]
 Visualize This: The FlowingData Guide to Design, Visualization, and Statistics (2nd Edition)
Brilliant! the only thing that would be interesting to add, are the names of the countries.
Great! but once you push the slider to higher pop densities it becomes hard to place the remaining “islands”, it would be helpful to leave a trace outline of the continents as a background, or have a setting to toggle an outline off and on.
Would love to see this graphic as a layer-cake … with the higher density in deeper colours, lower densities in declining depth of colour (like the cartographic convention of showing deeper water in deeper colours. Will try to do the same by taking screen shots of your graphic. Eric