Santiago, who I met at the Visualizar workshop, forwarded me his work on the visualization of del.icio.us tags and bookmarks called 6pli. Normally, I’m not a big fan of network diagrams, because I always seem to get lost in all the nodes and edges cluttering up the place. I feel differently about 6pli though.
6pli sets itself apart with really smooth, responsive interaction and three views – elastic net 3-d, elastic net 2-d, and circle 2-d. All three views rely on a metric of tag-similarity. So the more co-tags that a single tag has with its neighbors, the closer the tags will be in proximity.
Was that confusing? OK, it’ll be more clear with pretty pictures.
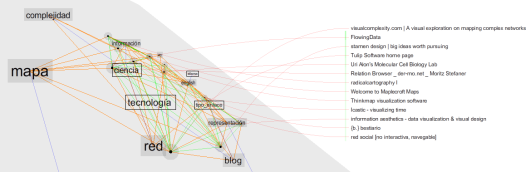
Elastic Net 3-D
The elastic net 3-D (pictured above) shows tags and bookmarks in a 3-dimensional view. Tags are in rectangles and bookmarks are circles. A bookmark (or circle) will be closer to another bookmark (or circle) if it has more tags in common. Similarly, if a tag is often grouped with other tags, it will appear closer to that group. Click on a tag, and a list of bookmarks show up on the right.
The cool part is when you start playing with the 3-D network blobby. You can rotate it like a globe and the movement is controlled by spring action. The visualization’s response is immediate and really smooth with nice transitions from one view to the next, unlike this paragraph.
Elastic Net 2-D
The 2-dimensional view is the same principle as the 3-D. The only difference is the 2-D is a projection of the 3-D view onto a flat plane. Smooth interaction still applies here.
Circle 2-D
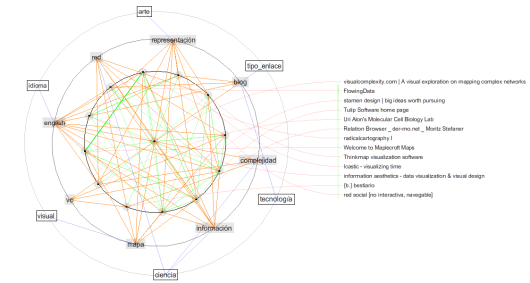
Finally, the circle view arranges tags and bookmarks into their del.icio.us bundles. Each circle is divided homogeneously and the radius of the circle can me manually modified.
One thing I would recommend for the beta release is some kind of input to type in a tag or the name of a bookmark. Right now, the starting point feels kind of random, but if I could specify where I wanted to explore, I think the viz would be that much more useful.
Check out my 6pli del.icio.us tags viz here.
 Visualize This: The FlowingData Guide to Design, Visualization, and Statistics (2nd Edition)
Hi Nathan, I agree Santiago Ortiz’s work is very exciting. I really found it interesting how many swipes he’s taken at del.icio.us in particular. I published an interview with him on my blog Serial Consign last summer and in the discussion he gets into talking about his process and influences a bit. 6pli is of course one of the main topics of conversation. :)
Pingback: Tags made visible explained | Everything is Miscellaneous
Nathan,
Since you said “Normally, I’m not a big fan of network diagrams” you have referenced at least 5 projects of network diagrams (I don´t want to count or make a graph of this)…
I´m curious about that… because I know what you mean when you say “I always seem to get lost in all the nodes and edges”.. I feel the same even on my own representations. But, as is easy to see, it seems that network diagrams became more and more common… My question is: there is a better way to represent a network than a network diagram?, at least, there are good alternatives?
I have my own answers, but I prefer to wait to your answer, or other people answers…
Santiago
maybe i should i append my previous comment. normally, i’m not a big fan of network diagrams as analytic tools. i think 6pli is the only network diagram project i didn’t put in the ‘artistic viz’ category.
i do think when you take an overview of a network diag, you do get some kind of “feeling” for relationships, etc; although it’s not necessarily analytical.
alternatives… it’ll depend on the data but from a statistical point of view, sometimes a scatterplot, or some other stat graphic that shows relationships. i don’t know. it depends on what you’re looking for too. one thing i do know though is that these network pieces don’t seem to make a ton of use of clustering algorithms. the nodes are usually arranged so that the viz isn’t clustered, but more attention could be placed on the similarities.
Pingback: Measuring Informational Distance Between Cities | FlowingData
Pingback: Trying to Make Sense of Media Convergence | design++