Packed Bubble Chart
Circle size represents data like with a bubble chart, but there is typically no x-y axis. Instead position often represents grouping or is used to maximize space.
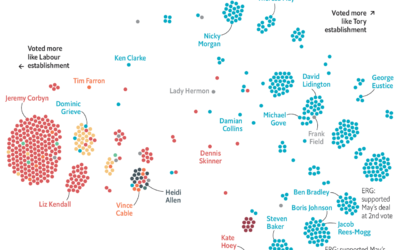
Brexit voting divisions
The Economist charted the divisions within political parties using Brexit votes as proxy.…
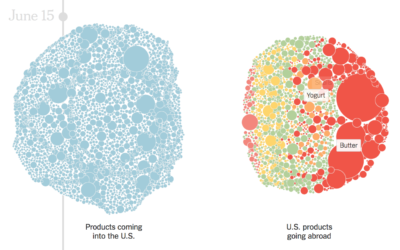
Products with tariffs in the trade war
The trade war started in January of this year when the administration imposed…
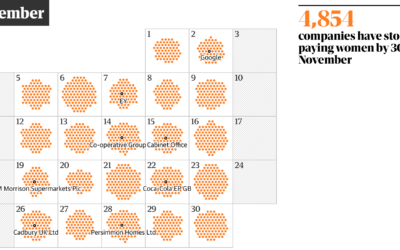
Day of the year companies stop paying women
One way to think about gender pay gap is to imagine women receive…
Floaty bubble charts with d3.js
D3.js, or Data-Driven Documents, version 4.0 was released a few months ago, so…
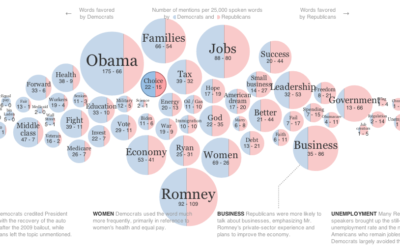
Words used at the National Conventions
The elections season is in full swing, and the New York Times graphics…