The Economist charted the divisions within political parties using Brexit votes as proxy. I’m here for the bubbles.
Brexit voting divisions
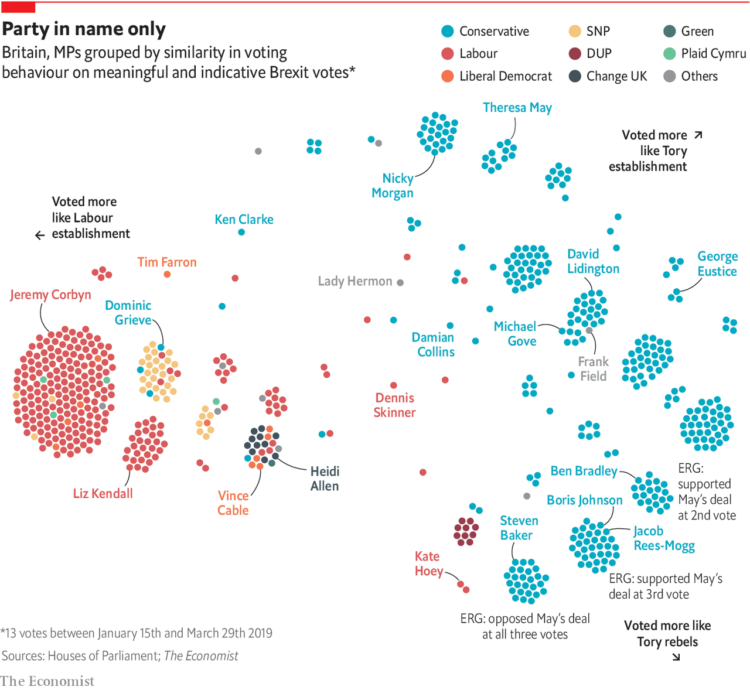
Chart Type Used

Second Edition
 Visualize This: The FlowingData Guide to Design, Visualization, and Statistics (2nd Edition)
 Visualize This: The FlowingData Guide to Design, Visualization, and Statistics (2nd Edition)
New tools, refined process.