Visualization
Showing the stories in data through statistics, design, aesthetics, and code.
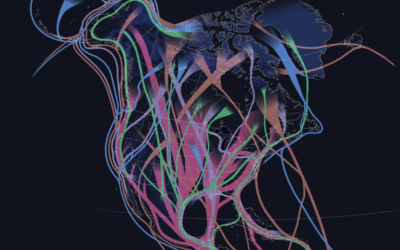
Traveling birds on a thousand-mile journey
Birds migrate to areas more hospitable, but where do they go? It depends…
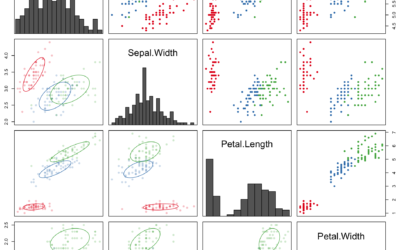
Beginner’s guide to visualization literacy
Mikhail Popov, a data scientist at the Wikimedia Foundation, led a workshop on…
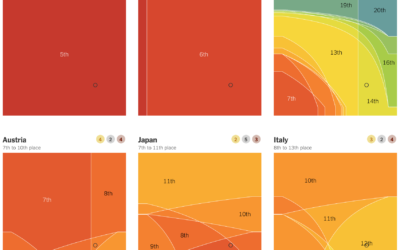
Who’s winning the medal race, depending on how you weight the medals
Every year, we look at the medal counts of each country. Who’s winning?…
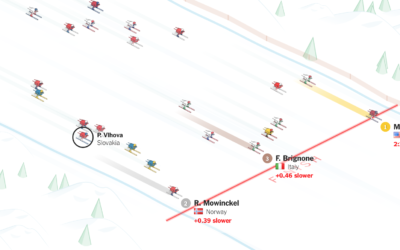
Mikaela Shiffrin pulling away for gold
Mikaela Shiffrin won her first gold medal in PyeongChang with a fraction of…

Visual introduction to the Fourier Transform
One of my least favorite electrical engineering courses in college was on signals…
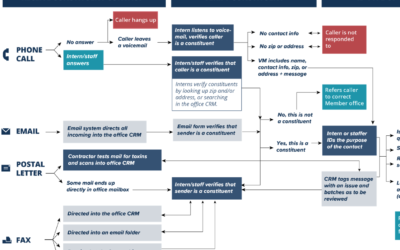
Where constituent input ends up
When you have input to send Congress, you have a number of communication…

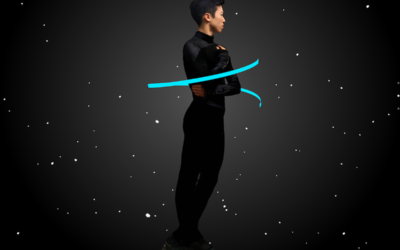
Olympians in your living room through augmented reality
Well this is awesome. The Winter Olympics start this Friday, and The New…
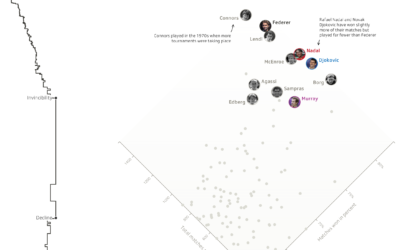
Roger Federer career in rankings and wins
Professional tennis player Roger Federer won his 20th Grand Slam title recently. He’s…
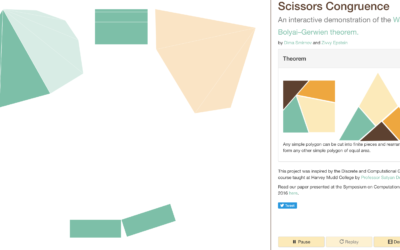
Scissors congruence
The Wallace–Bolyai–Gerwien theorem says that if you have two polygons of equal area,…
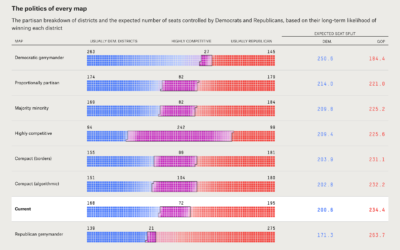
Redistricting the congressional map with different goals
FiveThirtyEight asks, “There’s a lot of complaining about gerrymandering, but what should districts…

Bruises
Musician Kaki King’s daughter suffers from a condition (Idiopathic Thrombocytopenic Purpura) where her…
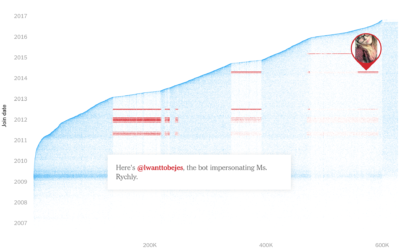
Finding fake followers
This fake follower piece by Nicholas Confessore, Gabriel J.X. Dance, Richard Harris, and…
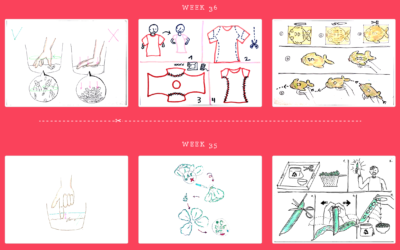
Hand-drawn how-to instructions using zero words
Inspired by Dear Data, the data drawing pen pal project, designers Josefina Bravo,…
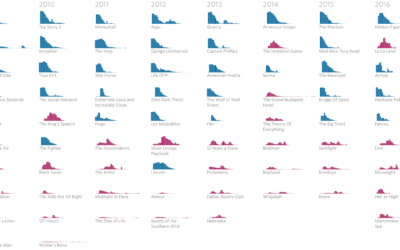
Release strategies for Oscar-nominated films
Evie Liu and William Davis, reporting MarketWatch, looked at release strategies of Oscar…
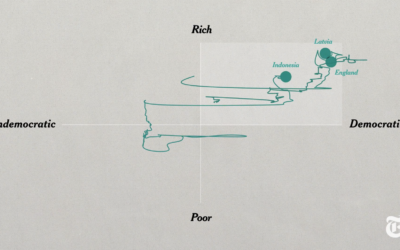
Is there something wrong with democracy?
Max Fisher and Amanda Taub, for The New York Times, answer the question…
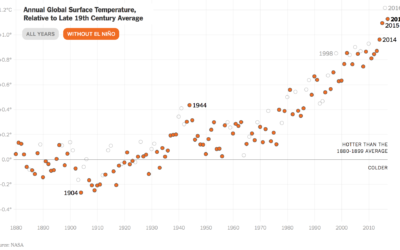
Surprise, the world was warmer again in 2017
According to NASA estimates, 2017 was the second warmest year on record since…