Visualization
Showing the stories in data through statistics, design, aesthetics, and code.
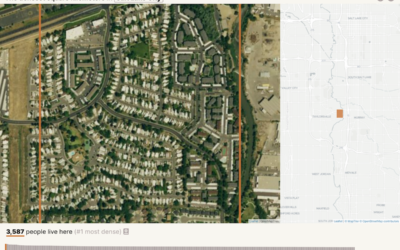
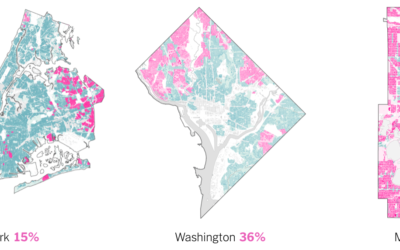
Searching for the densest square kilometer in different cities
Based on data from Gridded Population of the World, geographer Garrett Dash Nelson…
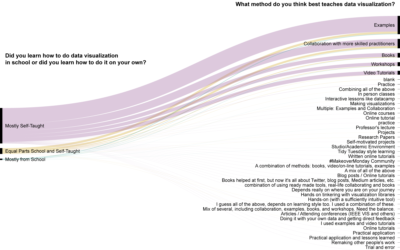
How practitioners learned data visualization
Visualization is still a relatively young field, so people learn about and how…
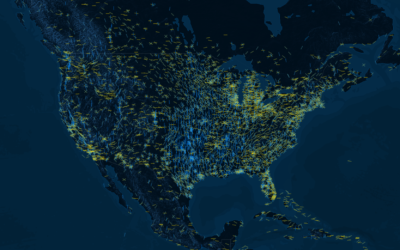
Airport runway orientation reveals wind patterns
Airport runways orient certain directions that correlate with wind direction in the area.…
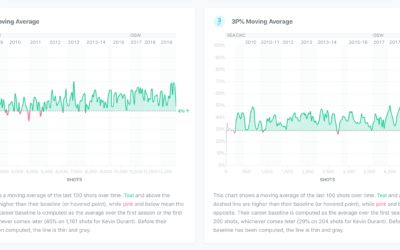
Exploration of players’ shot improvement in the NBA
Wondering whether if a player’s shot improves over the course of his career,…

Modern reproduction of an 1868 catalog of flower illustrations
Nicholas Rougeux, who has a knack and the patience to recreate vintage works…
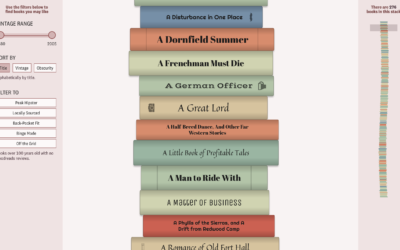
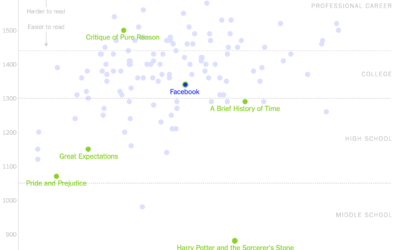
Data-driven hipster reading list
When it comes to reading lists, we usually look for what’s popular, because…

Atlas of all the moons in our solar system
National Geographic went all out on their atlas of moons. Space. Orbits. Rotating…
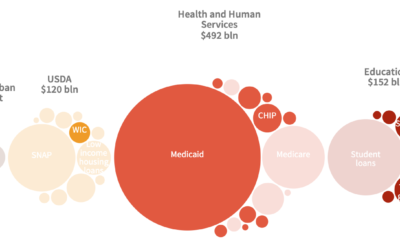
Cost of a Census undercount
The citizenship question for the upcoming Census is still stuck in limbo. One…

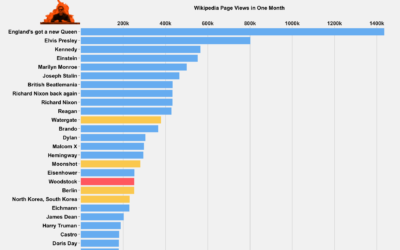
Wikipedia views and every line of Billy Joel’s “We Didn’t Start the Fire”
In the biggest crossover event of the century, Tom Lum used the Wikipedia…

A view on despair
Sonja Kuijpers used abstract imagery to represent some sobering numbers:
You might be…
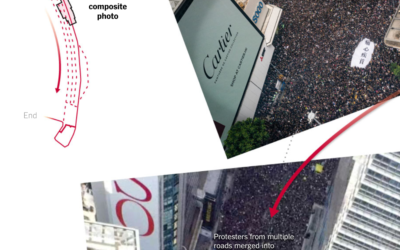
Scale of the Hong Kong protest
You know those sped up videos where there’s a long line for something…
Readability of privacy policies for big tech companies
For The New York Times, Kevin Litman-Navarro plotted the length and readability of…
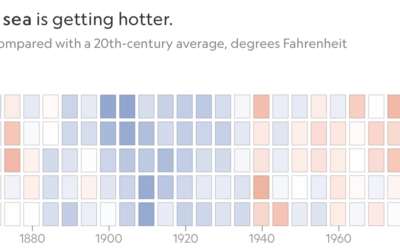
Increasing ocean temperatures, decreasing ice
For National Geographic, Kennedy Elliot made a series of heatmaps that show the…
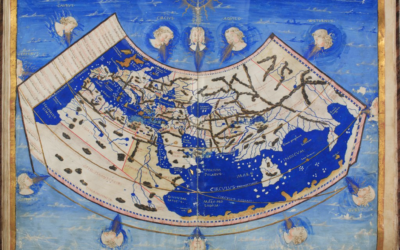
The role of cartography in early global explorations
For Lapham’s Quarterly, Elizabeth Della Zazzera turns back the clock to maps used…
What to expect at data visualization job interviews
Krist Wongsuphasawat, who recently interviewed for a healthy helping of visualization jobs, outlines…